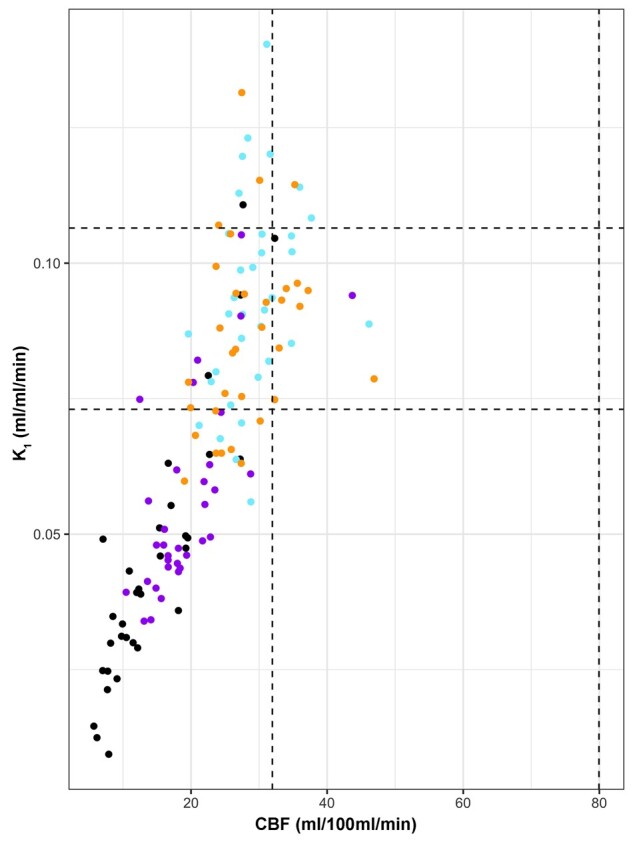
Figure 3.

Relationship between glucose transport and CBF based on region of interest data. Scatterplot of 18F-FDG transport (K1) and CBF in patient regions of interest: lesion core (black), penumbra (purple), peri-penumbra (blue) and normal-appearing (orange). The black vertical and horizontal dotted lines indicate the full range for healthy volunteer CBF and K1 values, respectively.
