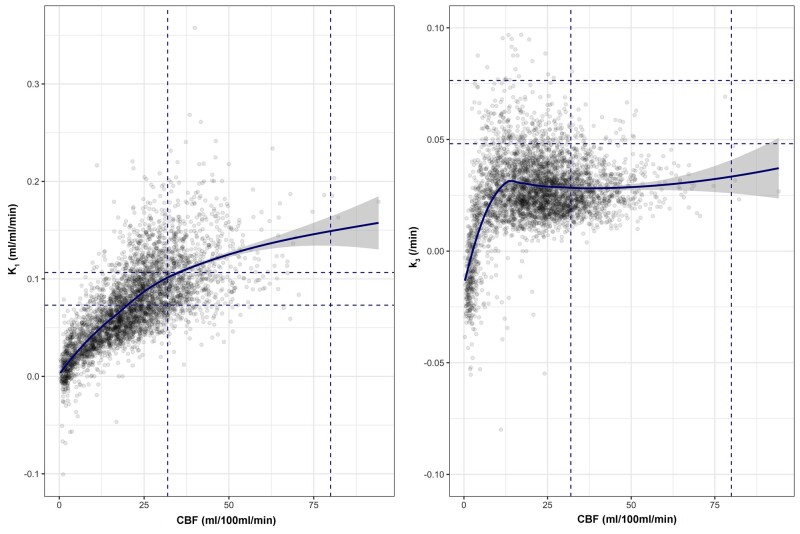
Figure 4.
Relationships between 18F-FDG kinetic parameters and CBF based on voxel data. For each PET imaging session in patients the relationship between CBF and 18F-FDG transport (K1; left) and phosphorylation activity (k3; right) is plotted for voxels across the whole brain. The fitted light blue lines represent modelling of the relationship between each parameter using locally weighted scatterplot smoothing (LOWESS), with the 95% confidence interval shown in grey. The blue vertical and horizontal dotted lines indicate the full range for healthy volunteer CBF and 18F-FDG kinetic parameters, respectively.

