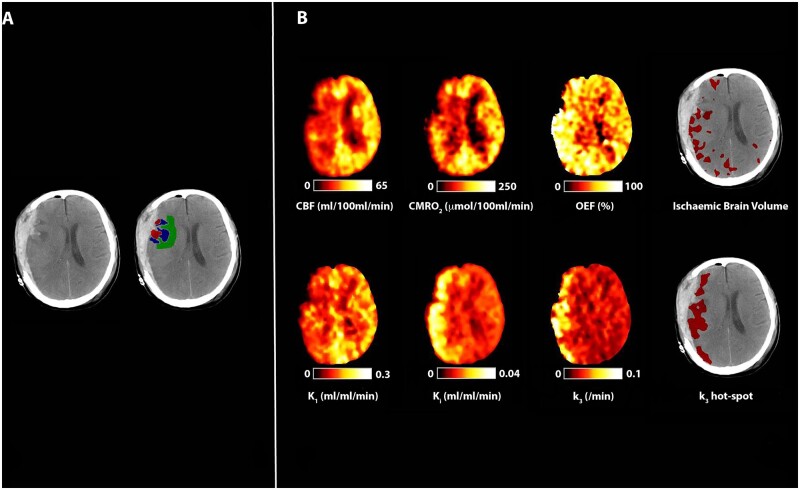
Figure 5.
Evidence of cerebral ischaemia and hyperglycolysis. CT, CBF, CMRO2, OEF, and 18F-FDG kinetic parameters obtained in a 40-year-old female within 24 h of severe TBI resulting from a fall. Imaging was obtained following evacuation of a subdural haematoma. Plasma glucose during PET was 3.7 mmol/l. (A) CT demonstrates residual subdural blood with minimal midline shift and underlying haemorrhagic contusions. Regions of interest are defined for haemorrhagic lesion (core, red), hypodense tissue (penumbra, blue), and a 1 cm border zone of normal-appearing tissue (peri-penumbra, green). (B) Co-registered parametric maps of CBF, CMRO2, OEF, K1, Ki and k3. The regions with a critical increase in OEF above the individually calculated threshold (ischaemic brain volume) and increased phosphorylation activity (k3 ‘hotspot’) are both shown in red overlying the CT scan. The ischaemic brain volume and k3 hotspot volume were 96 ml and 174 ml, respectively, and the volume of overlap between these two tissue classes in this patient was 38 ml.

