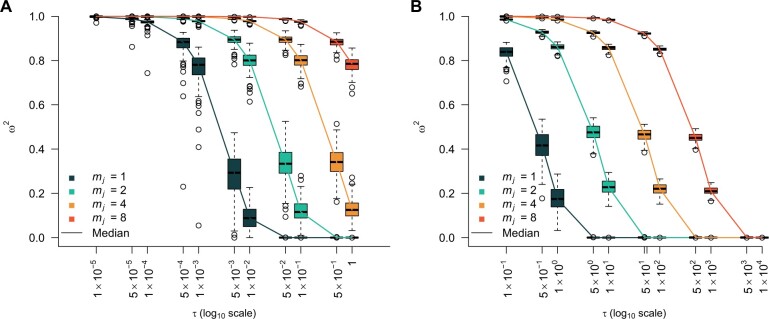
Figure 5.
Model rejection statistics for the HCV and bison data sets The metric  is calculated for each tree (see Equation 14) under a time-aware GMRF for various combinations of its smoothing parameter
  and
and  , the number of coalescent events per skyline segment. The box-plots summarize the resulting
  over 100 simulated trees that represent the demographic histories of the (A) Egyptian HCV and (B) Beringian bison data sets. The solid lines link the median values across boxes for a given
  and hence skyline dimension
  (
( ). We discourage the use of skyline models with
  .
.

