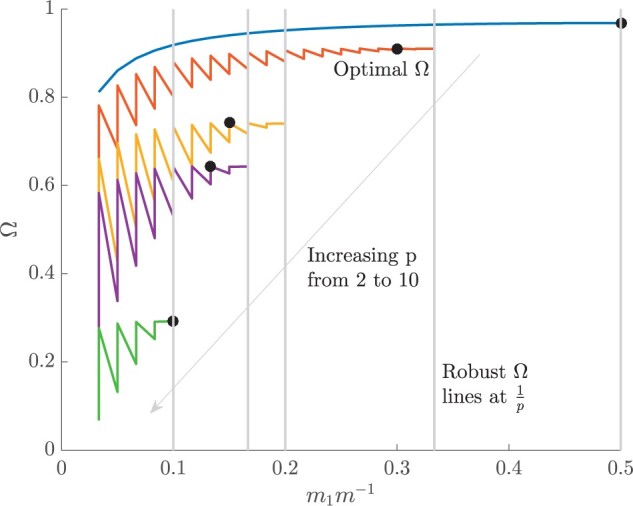
Figure A1.

Robust and  optimal designs. For the GMRF smoothing prior with
  for all
  and
and  , we show that the optimal
  design point is not always the same as the robust design point, at which
  . The colored
  curves are (along the dashed arrow) for
  at
at  , and computed across all partitions for any given
  (hence the zig-zagged form). The gray vertical lines mark the robust point for each
  curve, and the black circles give the optimal
  points. While these lines and circles do not always match, both generally feature approximately the same
  values. We found this to be the case across several
  and
and  values.
