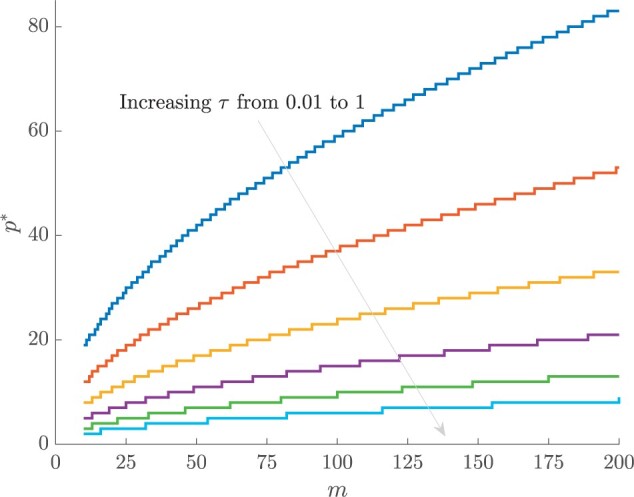
Figure A5.

Maximum  model selection boundary. For the GMRF smoothing prior with
  for all
  and at the robust point
  , we compute the maximum allowed number of skyline segments,
  , such that
  . These curves increase with
  and decrease with
  , indicating how the prior-data contribution can be used to define model rejection regions. Skylines with
  would be overly informed by the prior and hence should not be used.
