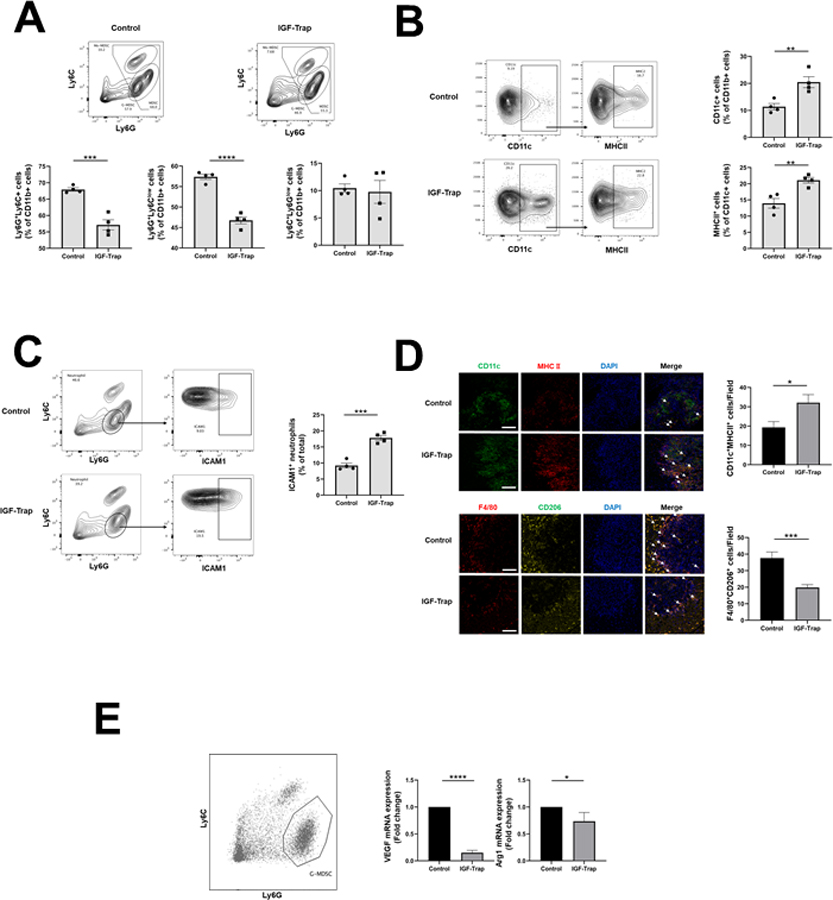
Figure 3. The IGF-Trap reduces the accumulation of immunosuppressive cells in PDAC liver metastases.

Liver immune cells were isolated 14 days post intrasplenic/portal injection of 1x10⁵ LMP cells and five i.v. injections of 5 mg/kg IGF-Trap or PBS on alternate days, and immunostained with the indicated antibodies. Shown in (A-top) are representative flow cytometric contour plots obtained with each of the indicated immune cell populations that were first gated for size, viability, and CD45 expression (for detailed gating strategy, see Supplementary Fig. 3). Shown in the bar graphs (A-bottom) are mean proportions (±SEM) of MDSC, G-MDSC, and Mo-MDSC per liver based on 4 mice per group, analyzed individually. Shown in (B- left) are representative flow cytometric contour plots of activated dendritic cells identified based on expression CD11c and MHCII and in the bar graphs (B-right) the mean proportions (±SEM) of CD11b+MHCII+ per liver based on 4 mice per group, analyzed individually. Shown in (C-left) are representative contour plots obtained for CD11b+Ly6GhighLy6Clow cells expressing ICAM-1 and in the bar graph (C-right) the mean proportions (±SEM) of Ly6G+ICAM-1+ cells (markers of N1 neutrophils) in each group based on analysis of these mice. In a separate experiment, the same treatment protocol was used, and cryostat sections prepared for analysis by IHC. Shown in (D-left top) are representative confocal images of 10 μm cryostat liver sections immunostained with the indicated antibodies followed by Alexa Fluor 568 (green) for CD11c, Alexa Fluor 647 for MHCII (red), and DAPI (blue). Shown on the right of the confocal images are the mean numbers (±SEM) of the indicated cells per field counted in 15–20 fields per section (n=2 or 3) derived from 3 mice per group. Shown in (D left-bottom) are representative confocal images obtained with the indicated antibodies followed by Alexa Fluor 568 (red) for F4/80, Alexa Fluor 647 (yellow) for CD206, and DAPI (blue). Shown on the right of the confocal images are the means (± SEM) of the indicated cells counted as in (D-top). MDSC were functionally characterized using a T cell proliferation assay. Shown in (E) are results of qPCR analysis performed on RNA extracted from FACS sorted neutrophils (left). Results in the bar graph are based on 3 separate analyses and expressed as means (± SD) expression levels (normalized to GAPDH) relative to untreated mice that were assigned a value of 1. Scale bar (D) - 100μm; *p ≤ 0.05; **P < 0.01; ***P < 0.001; ****P < 0.0001.
