
Fig. 4. IGF-Trap treatment enhances T cell recruitment and potentiates their function in the TME.
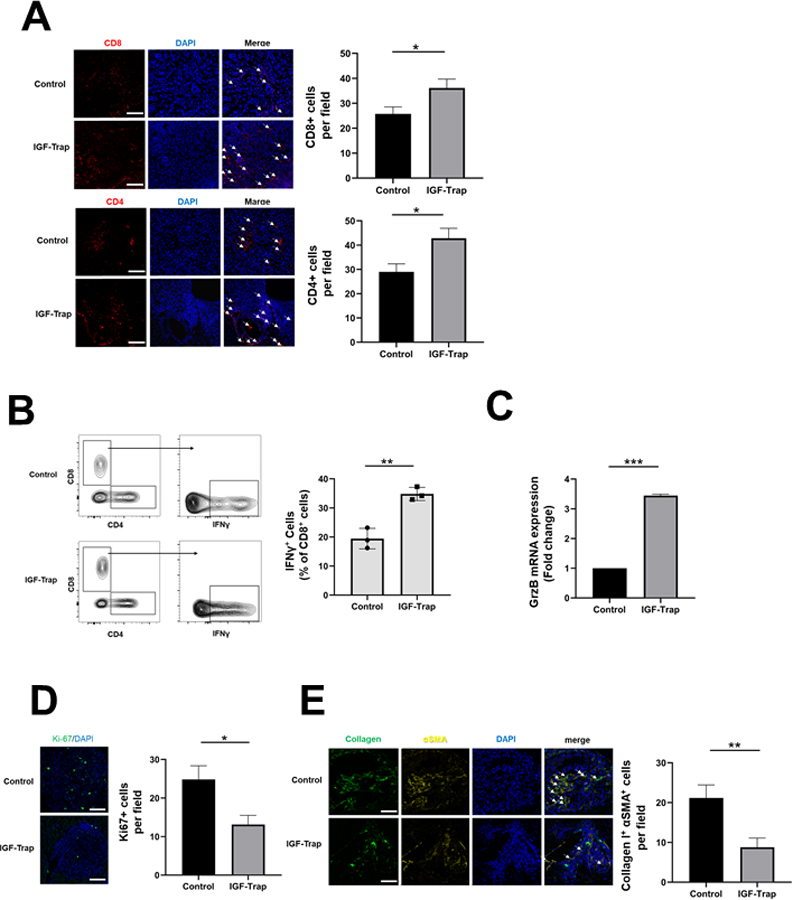
B6129 F1 mice were injected via the intrasplenic/portal route with 1x10⁵ LMP cells, treated with 5 mg/kg IGF-Trap or PBS 1, 4, 7, and 10 days post tumor inoculation and sacrificed on day 14. Shown in (A) are representative confocal images of 10 μm cryostat liver sections immunostained with the indicated antibodies and Alexa Fluor 568 (red) for CD8 (A-top), Alexa Fluor 568 (red) for CD4 (A-bottom) and DAPI (blue). Shown in the bar graphs (right) are the mean numbers (± SEM) of the indicated cells per field counted in 15–20 fields per section derived from 3 mice per group. Shown in (B-left) are results of flow cytometry performed on immune cells which isolated from mice treated as described in (A) and stimulated for 4 h with PMA and ionomycin in the presence of a protein transport inhibitor. Shown in the bar graph (B-right) are the mean proportions of CD8+IFN-γ+ cells per liver (±SEM) based on 3 livers per group analyzed individually. Shown in (C) are results of qPCR (±SEM) performed on RNA extracted from CD3+CD8+ T cells that were FACS sorted from livers of tumor-injected mice treated as in (A) (data normalized to GAPDH; n=3), in (D-left) representative confocal images of cells immunostained with antibodies to Ki-67 (green) and with DAPI (blue) and in (D-right) the mean numbers (±SEM) of Ki67+ cells per field based on 15–20 sections obtained from 3 animals per group. The effect of IGF-Trap on hepatic stellate cell activation (E) was analyzed in B6129-Col-GFP mice. Mice were injected via the intrasplenic/portal route with 1x10⁵ LMP cells, treated with 5 mg/kg IGF-Trap or PBS on days 2 and 4 post tumor inoculation and sacrificed on day 7. Activated HSC recruited into tumor-infiltrated areas and identified based on type I collagen production and α-SMA expression were quantified. Shown in (E-left) are representative confocal images of 10 μm cryostat liver sections immunostained with antibodies to α-SMA followed by Alexa Fluor 568 secondary antibody (yellow), DAPI- stained (blue) and expressing Col-GFP (green). Shown in the bar graph (E-right) are the mean numbers of activated HSCs per field (±SEM) based on 15–20 sections obtained from 3 animals per group. Scale bars (A, D) - 100 μm; (E) - 50 μm; *p ≤ 0.05; **P < 0.01; ***P < 0.001.