
Figure 7. Increased T cell recruitment and decreased PD-1 expression in the liver TME following combinatorial therapy.
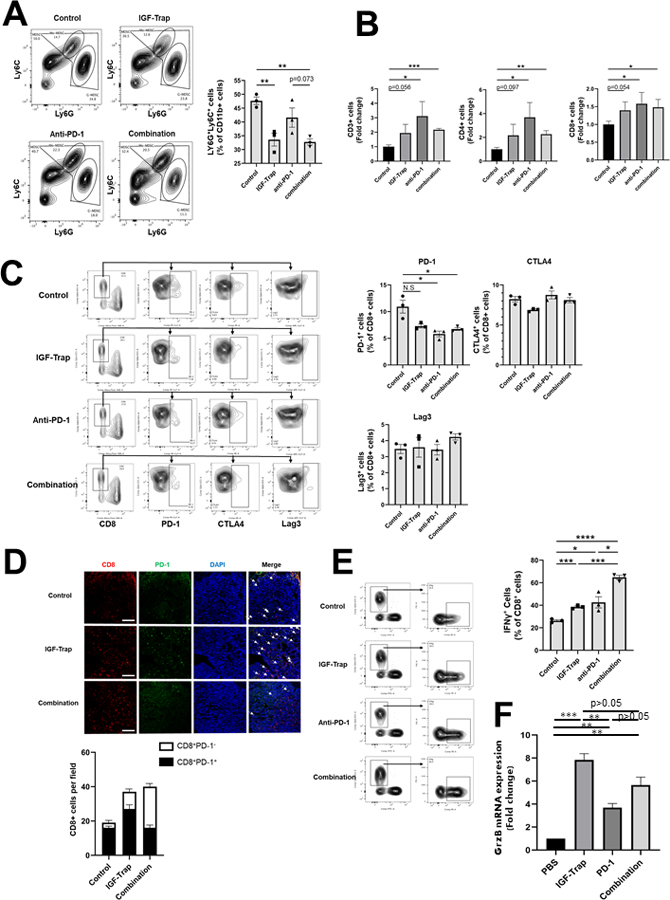
Liver immune cells were isolated 14 days post intrasplenic/portal injection of 1x10⁵ LMP cells and the treatment protocol described in the legend to Fig 6 and analyzed by flow cytometry. Shown in (A-left) are representative flow cytometric contour plots obtained with each of the indicated immune cells populations that were first gated as outlined in Supplementary Fig. 3, and in the bar graphs (A-right) the mean proportions (%) (±SEM) of MDSC per liver based on 3 mice per group, analyzed individually. Shown in (B) are the mean numbers of the indicated cells obtained per liver (±SEM) expressed as a ratio to untreated mice that were assigned a value of 1 and based on 3 mice per group, analyzed individually. Shown in (C) are representative contour plots obtained for CD8+ cells immunostained with antibodies to the indicated immune checkpoints and in the bar graphs the relative proportions (%) of positive T cells (±SEM) based on the analyses of 3 livers per group. Shown in (D-top) are representative confocal images of 10 μm cryostat liver sections immunostained with the indicated antibodies followed by Alexa Fluor 568 (red) for CD8, Alexa Fluor 647 for PD-1 (green), and DAPI (blue) and in (D-bottom) are the mean numbers (±SEM) of the CD8+ T cells per field (expressing or not PD-1), counted in 15–20 fields per section derived from 3 mice per group. Note that the number of CD8+ T cells increased significantly in both IGF-Trap and combination therapy-treated mice but the ratio of PD-1+:CD8+ cell decreased significantly only in mice that received the combination therapy. Shown in (E-left) are results of flow cytometry performed on immune cells which were isolated from mice treated as in (A) and stimulated for 4 h as described in the legend to Fig 4. Shown in the bar graph (E-right) are the mean proportions of CD8+IFN-γ+ cells per liver (±SEM) based on 3 livers per group, analyzed individually. Scale bar- 100μm; Shown in (F) are results of qPCR (±SEM) performed on RNA extracted from CD3+CD8+ T cells that were FACS sorted from livers of tumor-injected mice treated as in (A) (data normalized to GAPDH; n=3). *p ≤ 0.05; **P < 0.01; ***P < 0.001; ****P < 0.0001; NS-not significant.