FIG. 4.
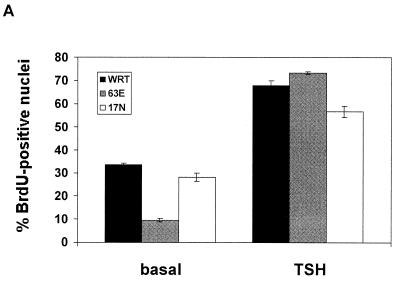
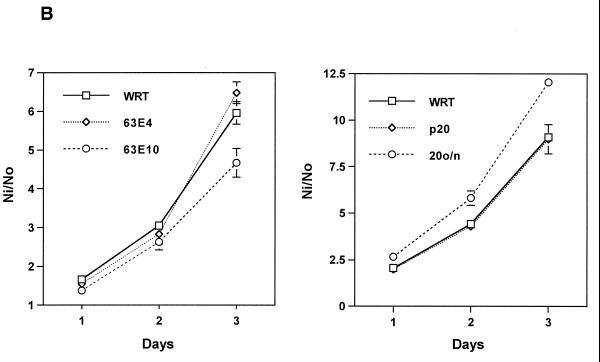
Rap1A and cell proliferation. (A) DNA synthesis was assessed in cells arrested in insulin-supplemented basal medium and following stimulation with TSH for 48 h. Parental cells (WRT) are shown in black bars, Rap1A63E cells in gray bars and Rap1A17N cells in white bars. The bars indicate the mean ± the standard error of the mean from five experiments. Similar results were observed in three Rap1A63E cell lines and in two Rap1A17N cell lines. (B) Growth rates were determined in WRT cells and in two Rap1A63E (clones 4 and 10) and Rap1A17N (p20, 20o/n) cell lines. Rap1A17N pool 20 (p20) was derived from a mass population of transfected cells, while 20o/n is a clonal line. Expression of transfected Rap1A17N in these lines was similar to that of Rap1A63E in clone 4. The bars indicate the mean ± the standard error of the mean from four independent experiments. Ni/No is the ratio of the cell number at each day (Ni) over the number of cells plated at day 0 (No).


