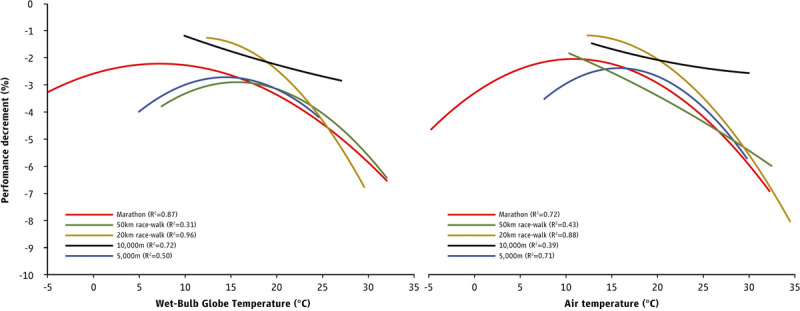
FIGURE 4.

Performance decrement (percent difference between an athlete’s finish time and the event’s standing record) for every degree WBGT (left) and air temperature (right) across the studied events based on linear and nonlinear regression analyses using the least squares method. Performance is always negative (indicating impaired average performance) because, on average, the percent difference from the standing record was negative. The models for marathon do not include well-trained athletes. No curves are shown for the 3000-m steeplechase as the associated models did not satisfy the least squares fit criterion of P < 0.005.
