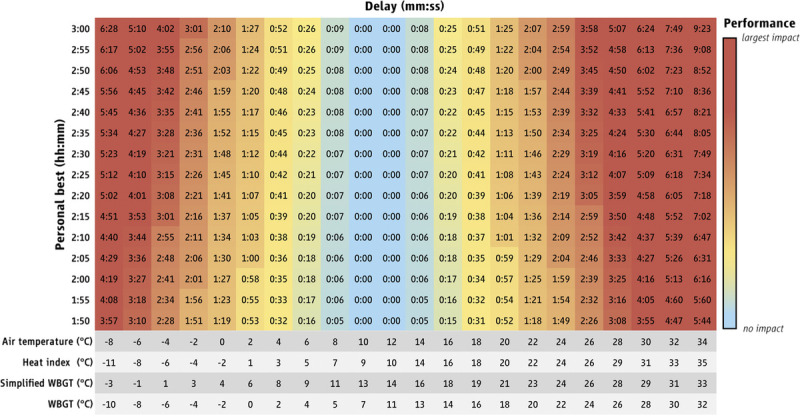
FIGURE 5.

The effect of heat stress on marathon performance, across a wide range of finishing times. Numbers indicate minutes:seconds of added time to performance based on the air temperature, heat index, simplified WBGT, and WBGT. Colors illustrate the level heat-induced effect on performance. Performance is either unaffected or impaired because, on average, the percent difference from the standing record was negative.
