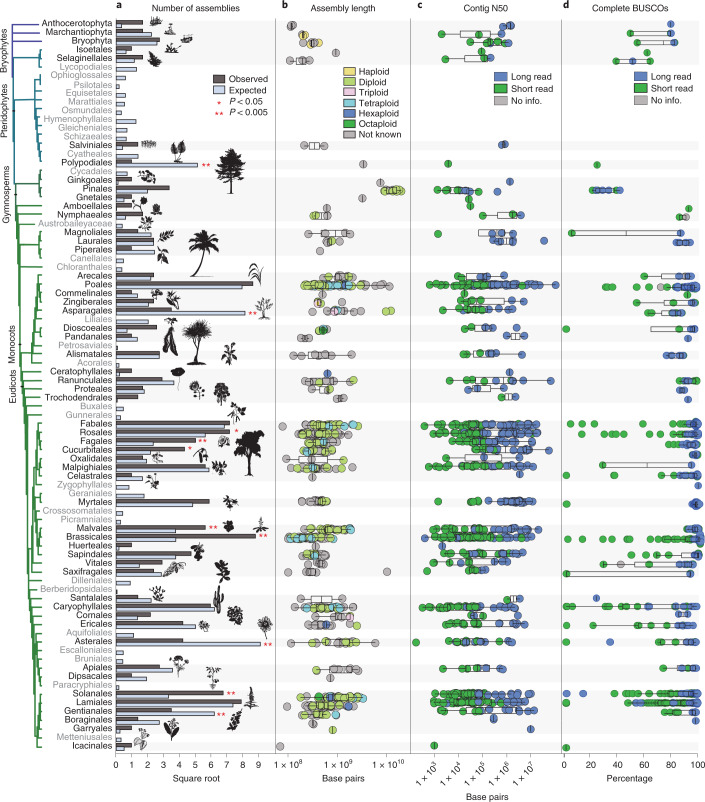
Fig. 2. Comparison of genome availability and quality metrics for each land plant order.
a, The number of species with publicly available genome assemblies as of January 2021 (n = 798) versus the number expected for each order. Significance values were calculated using Fisher’s exact test. Orders with no genome assemblies are shown in grey. Bryophytes are plotted at the phylum level, but Extended Data Fig. 2 shows bryophyte orders. Orders showing significant over- or under-representation are marked with asterisks. Over-represented orders include Brassicales (P = 3.03 × 10⁻¹³), Cucurbitales (P = 0.0038), Fagales (P = 0.0003), Malvales (P = 0.0084), Rosales (P = 0.0286) and Solanales (P = 1.27 × 10⁻⁶). Under-represented orders include Asparagales (P = 2.62 × 10⁻¹¹), Asterales (P = 1.00 × 10⁻¹⁰), Gentianales (P = 0001) and Polypodiales (P = 8.93 × 10⁻⁸). b, Box plots showing the distribution of assembly length for each order of land plants. Points are coloured by ploidy. c, Box plots showing the distribution of contig N50 for each order of land plants. d, Box plots showing the distribution of complete BUSCO percentages for each order of land plants. c,d, Points are coloured by sequencing technology. For all box plots, the box defines the interquartile range (25th–75th percentile) and the centre line represents the median; whiskers extend to the maximum and minimum data values.

