
Extended Data Fig. 2. Quality and representation of polyploid assemblies.
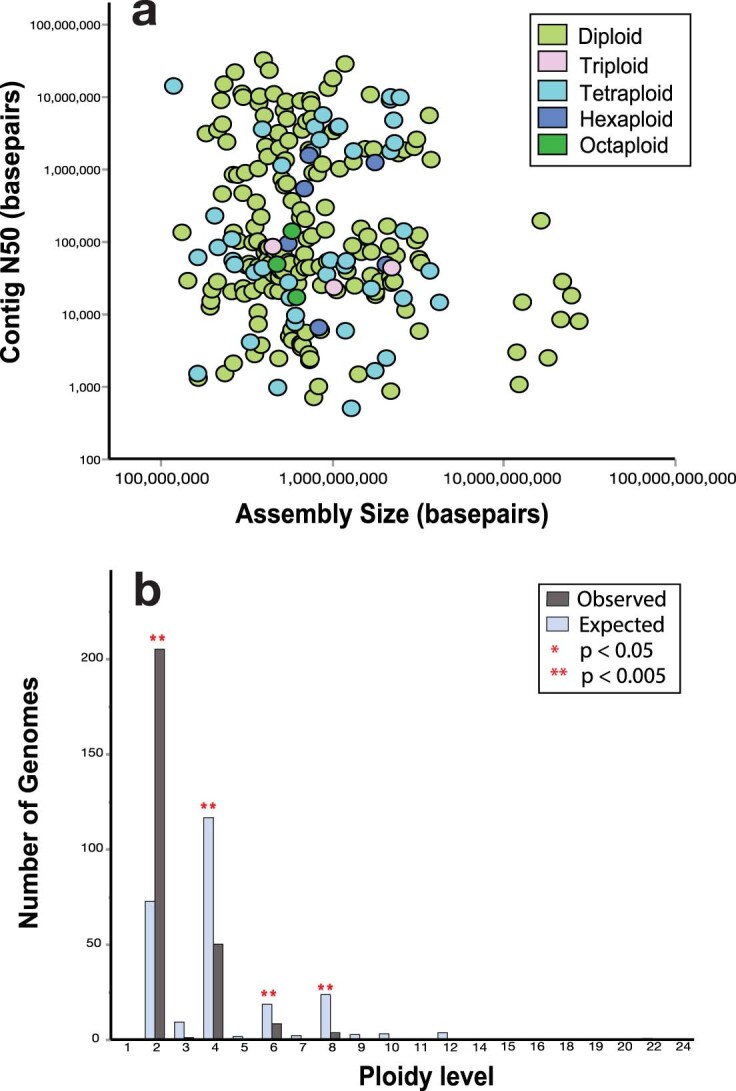
a, Genome assembly contiguity (N50) by assembly size for the 268 species with ploidy infromation. Contiguity is not associated with differences in genome size. The ploidy level of each genome is indicated by color. The mean N50s of polyploid and diploid genomes do not differ significantly. b, The observed vs. expected number of genome assemblies available for each ploidy level. Significance values were calculated using Fishers Exact Tests. Diploid genomes are statistically over-represented (P = 7.10e-11) and tetraploid (P = 3.13e-29), hexaploidy (P = 0.0465), and octoploid (P = 1.20e-04) genomes are statistically underrepresented. Ploidy levels that showed a significant over- or under-representation are marked with ** (P < 0.005) or * (P < 0.05).