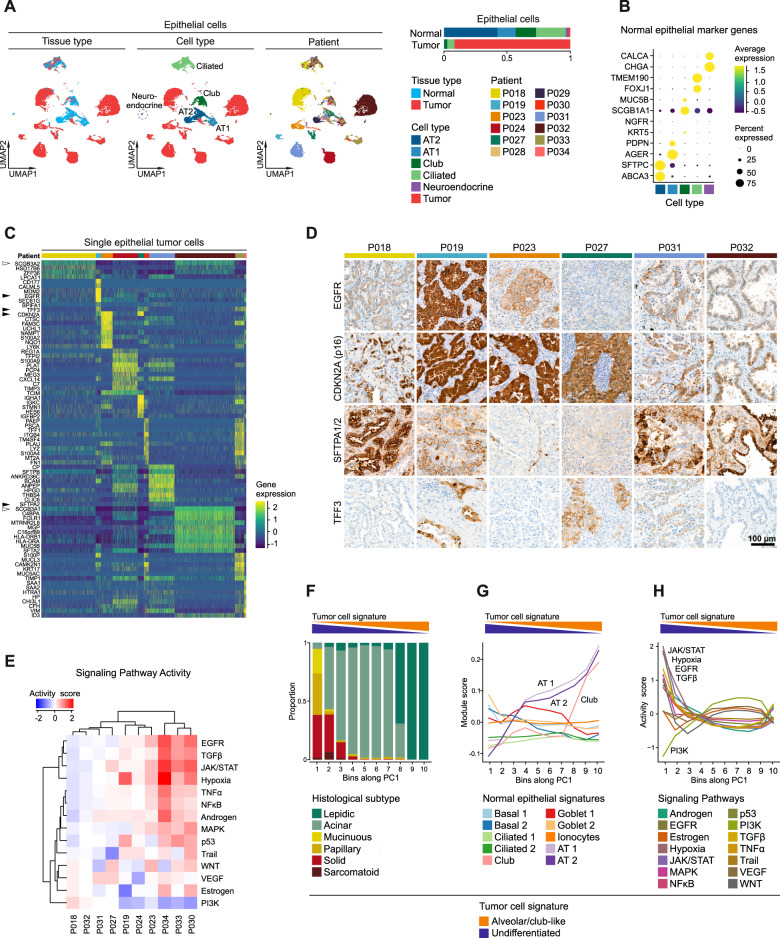
Fig. 2. Intertumoral heterogeneity of tumor epithelial cells in lung adenocarcinomas.
A UMAPs based on the top 20 principal components of all epithelial single-cell transcriptomes color-coded by tissue type, cell type and patient, and quantification of epithelial cell types per tissue type, AT1, alveolar type 1 cells, AT2, alveolar type 2 cells. B Average gene expression of selected marker genes for normal epithelial cell types. C Differentially expressed genes in tumor epithelial cells grouped by patients, maximum top ten genes showed per patient, for patient color code see (A). D Immunohistochemical staining of proteins encoded by selected differentially expressed genes indicated by black arrowheads in (C). E Mean pathway activity scores of tumor epithelial cells grouped by patient. F Distribution of histological subtypes, (G) mean module scores of normal epithelial cell type gene signatures, and (H) mean pathway activity scores of tumor epithelial cells sorted along principal component 1 (PC1). F, G, H Principal component analysis based on gene expression of all tumor epithelial single-cell transcriptomes; schematic depiction of tumor cell signature module scores along PC1.

