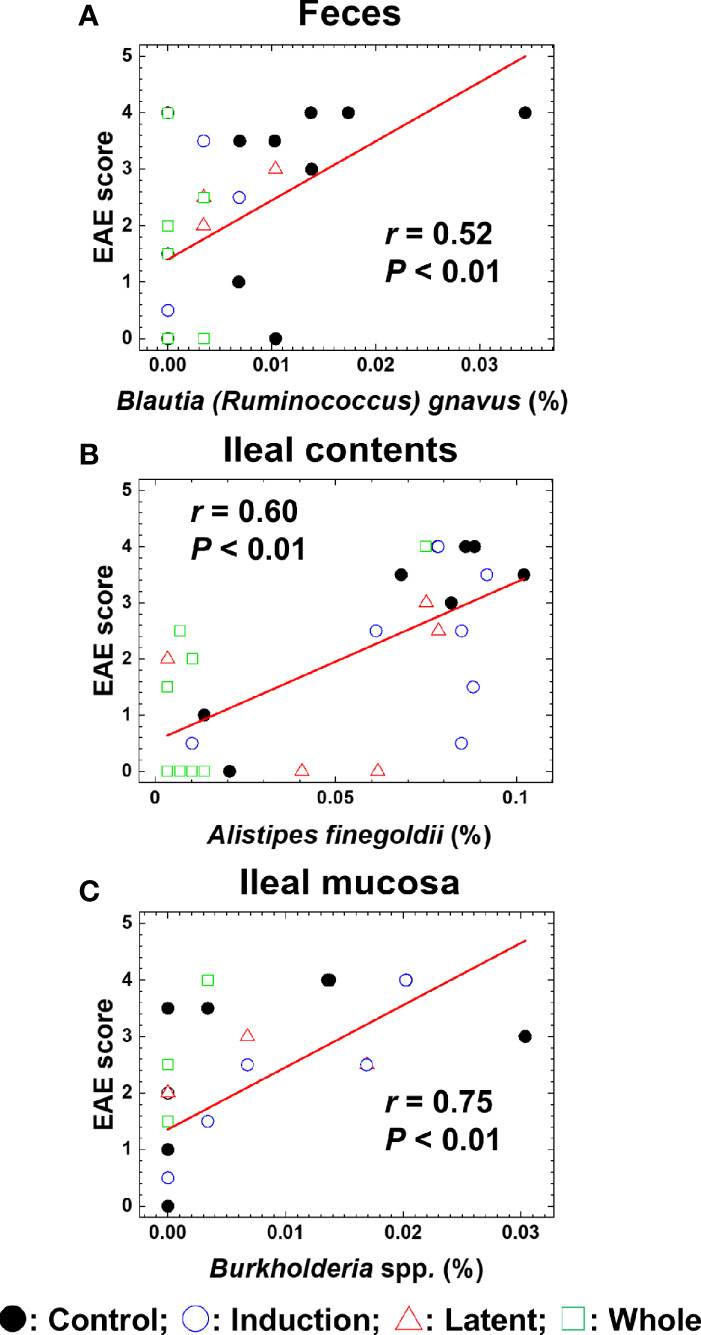
Figure 6.

Pattern matching between the EAE scores and relative abundance of bacterial species. (A–C) We conducted pattern matching to correlate the EAE scores with the relative abundance of individual bacterial species in feces (A), ileal contents (B), and the ileal mucosa (C). The figures are the representative bacterial species correlated with the EAE scores at the three anatomical sites. These bacterial species significantly decreased in the CMG-treated groups (Induction, blue circle; Latent, red triangle; and Whole, green square), compared with the control group (Control, black circle) ( Table 3 ): (A) Blautia (Ruminococcus) gnavus in feces (Induction, Latent, and Whole < Control), (B) Alistipes finegoldii in ileal contents (Whole < Control), and (C) Burkholderia spp. in the ileal mucosa (Whole < Control).
