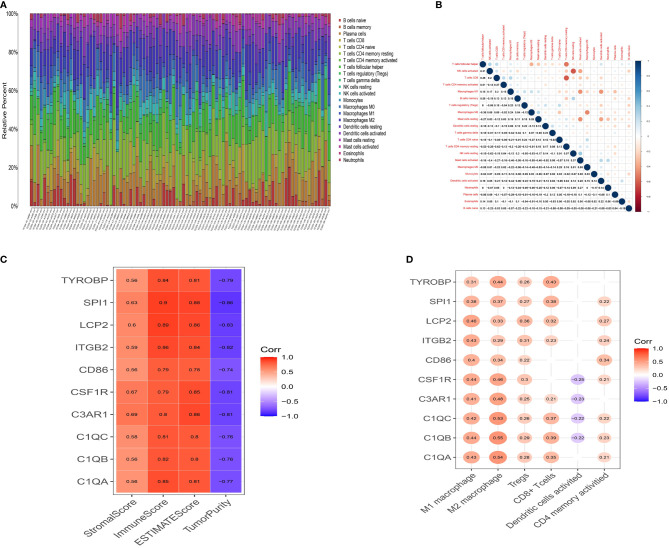
Figure 5.
Landscape of tumor infiltration cells in ESCC. (A) Barplot for the proportion of 22 types of immune cells in ESCC tissues. Column names are sample ID. (B) Heatmap for the correlations between the levels of immune cells among ESCC samples. (C) Heatmap for correlation between 10 genes and StromalScore, ImmuneScore, ESTIMATEScore and TumorPurity (p<0.05). (D) Heatmap for correlation between 10 genes and six immune cells. The blank means that the p-value is nonsignificant.

