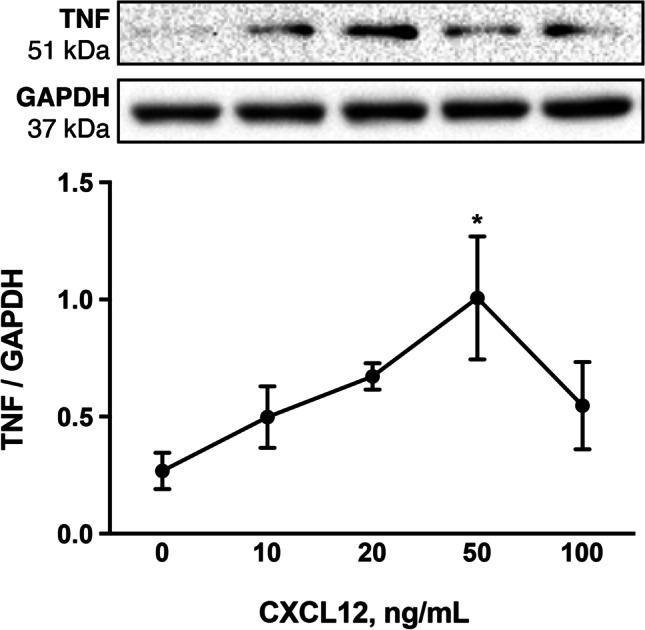
Fig. 5.

KGN TNF protein levels in response to increasing doses of CXCL12. Abundance of TNF following administration of CXCL12 at concentrations ranging from 0 to 100 ng/mL. Representative immunoblot for both protein of interest and GAPDH (loading control). Normalized optical densitometry values of TNF are graphed using the mean ± SEM. Asterisks indicate difference relative to control (0 ng/mL) at P < 0.05 (*). Experiments were repeated a minimum of 4 times
