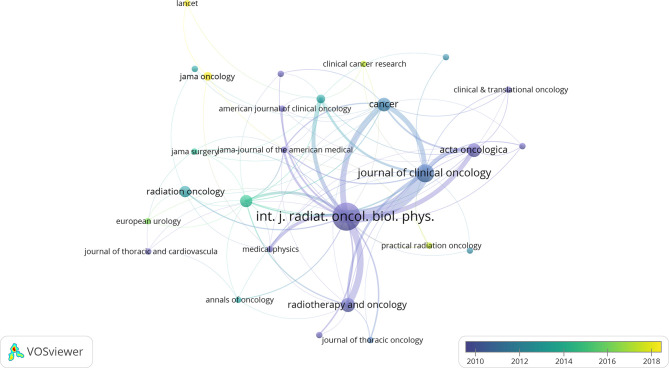
Figure 2.
The network visualization of journals from the 100 most cited articles according to the average published year. The circle size represents the number of articles in the 100 most cited articles. The width of the curved line represents the link strength. The distance between 2 journals approximately indicates the relatedness of the nodes.

