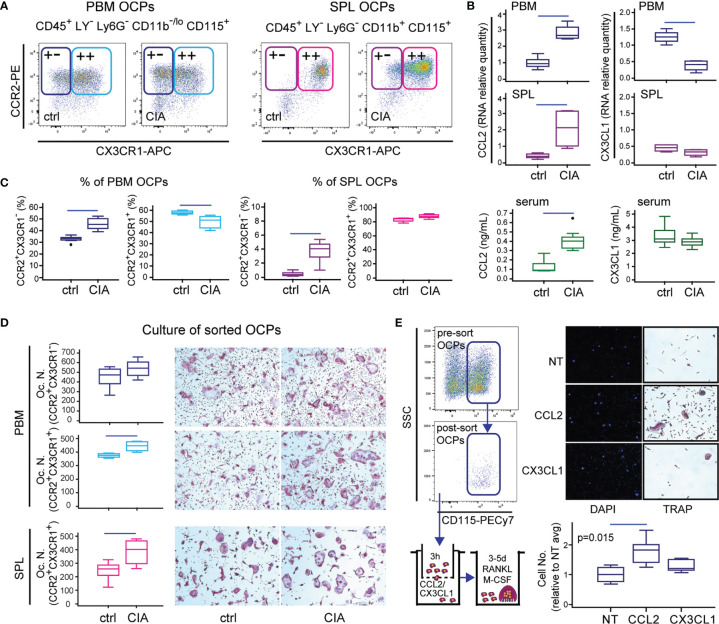
Figure 2.
Importance of the CCL2/CCR2 and CX3CL1/CX3CR1 axes in B6 mice with collagen-induced arthritis (CIA). (A) Representative dot plots for flow cytometric analysis of CCR2 and CX3CR1 expression on osteoclast progenitors (OCPs) defined as CD45+CD3-B220-NK1.1-Ly6G-CD11b-/loCD115+ cells in periarticular bone marrow (PBM) and CD45+CD3-B220-NK1.1-Ly6G-CD11b+CD115+ cells in spleen (SPL) of control (ctrl) and CIA mice. (B) qPCR analysis of chemokine gene expression levels in PBM and SPL presented as relative quantity of RNA, and serum levels of chemokine ligands measured by enzyme-linked immunosorbent assay (ELISA), in ctrl and CIA mice. (C) Proportion of single-positive (CCR2+CX3CR1-) and double-positive (CCR2+CX3CR1+) OCPs in PBM and SPL of ctrl and CIA mice. (D) Osteoclastogenic potential of single-positive (PBM CCR2+CX3CR1-) and double-positive (PBM and SPL CCR2+CX3CR1+) OCPs of ctrl and CIA mice. Sorted cells were plated and stimulated by receptor activator of nuclear factor κB ligand (RANKL) and macrophage colony-stimulating factor (M-CSF). Differentiated tartrate-resistant acid phosphatase (TRAP)+ multinucleated osteoclast-like cells were counted per well (Oc.N.). Representative microphotographs of in vitro differentiated TRAP+ osteoclast-like cells are presented (magnification 100×). (E) In vitro migration assay of sorted PBM OCPs of arthritic mice (CIA) using Transwell system. Cells migrated to the bottom membrane of the insert were stained with 4’,6-diamidino-2-phenylindole (DAPI), counted (n = 2 wells per group; 7 fields per well), and normalized to the average value of non-treated group (NT avg). Cells that migrated to the lower chamber were cultured with RANKL and M-CSF. Representative images of NT, CCL2- and CX3CL1-attracted cells (nuclei stained with DAPI) and in vitro differentiated TRAP+ osteoclast-like cells are presented (magnification 100×). The experiments were repeated three times and pooled data are shown (n = 6–10 mice per group). Values are presented as medians (middle horizontal lines), boxes represent the interquartile range (IQR), whiskers represent 1.5 times the IQR, and outliers are represented by circles. Statistically significant difference was determined at p < 0.05, Mann–Whitney U-test (B–D) or Kruskal–Wallis test (p-value marked on the graph) with Conover post-hoc test for group-to-group comparisons (E); correction for multiple comparisons (B) was performed using Holm–Bonferroni method; line denotes significant difference between groups. LY—CD3/B220/NK1.1.

