
Figure 4.
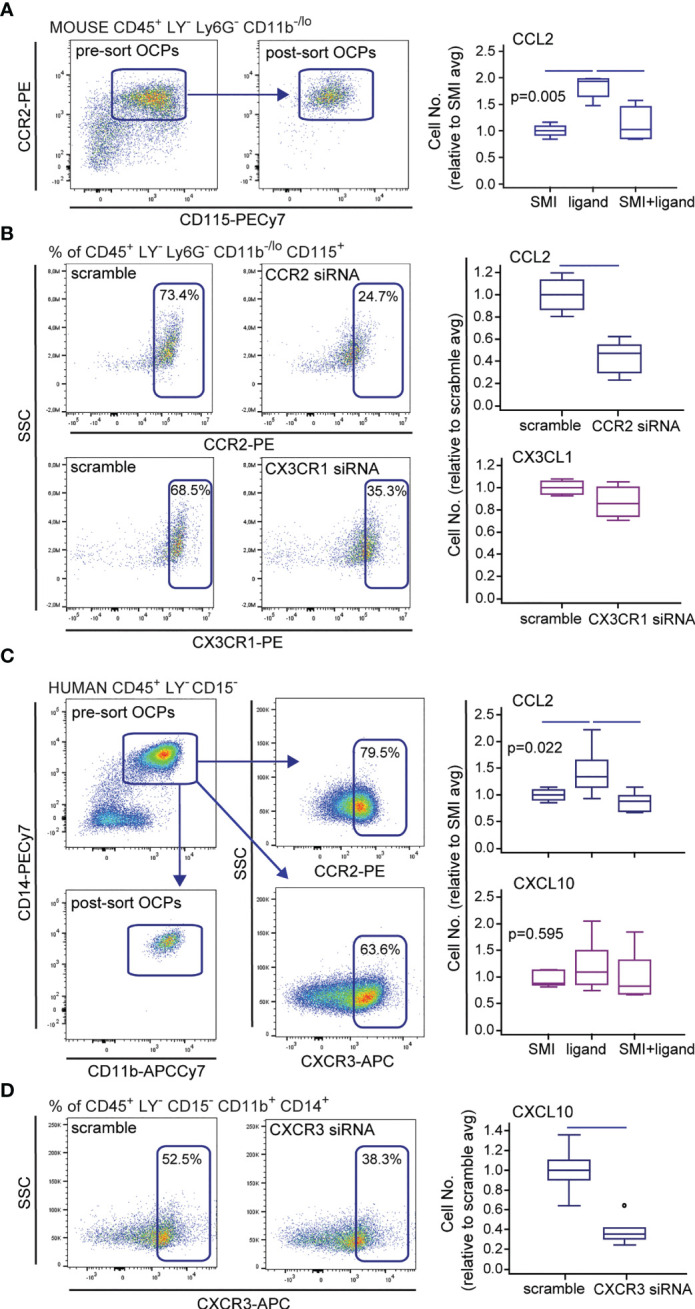
Effect of small-molecule inhibitors (SMIs) and small interfering (si)RNA on migration of mouse and human osteoclast progenitors (OCPs) in vitro. Representative flow cytometry data of sorted population and chemokine receptor expression, and siRNA knockdown (CCR2 and CX3CR1 for mouse and CXCR3 for human cells) are shown on dot plots. (A) Sorted mouse periarticular bone marrow (PBM) OCPs bearing the phenotype CD45+CD3-B220-NK1.1-Ly6G-CD11b-/loCD115+ from arthritic mice (CIA) were subjected to the in vitro migration assay toward the CCL2 gradient under the CCR2 SMI treatment, using the Transwell system. (B) Sorted mouse PBM OCPs bearing the phenotype CD45+CD3-B220-NK1.1-Ly6G-CD11b-/loCD115+ from arthritic mice (CIA) were subjected to the in vitro migration assay toward the CCL2 and CX3CL1 gradient following CCR2 or CX3CR1 siRNA treatment, respectively, using the Transwell system. (C) Sorted human peripheral blood (PBL) OCPs bearing the phenotype CD45+CD3-CD19-CD56-CD11b+CD14+ from arthritic patients (RA) were subjected to the in vitro migration assay toward the CCL2 or CXCL10 gradient under the CCR2 or CXCR3 SMI treatment, respectively, using the Transwell system. (D) Sorted human PBL OCPs bearing the phenotype CD45+CD3-CD19-CD56-CD11b+CD14+ from RA patients were subjected to the in vitro migration assay toward the CXCL10 gradient following CXCR3 siRNA treatment, using the Transwell system. Cells migrated to the bottom membrane of the insert were stained with 4’,6-diamidino-2-phenylindole (DAPI) and counted. Values are normalized to the average value of control group (SMI or scramble avg), and presented as medians (middle horizontal lines), boxes represent the interquartile range (IQR), whiskers represent 1.5 times the IQR, and outliers are represented by circles. The experiments were repeated three times and pooled data are shown (n = 6–8 Transwells per group). Statistically significant difference was determined at p < 0.05, Kruskal–Wallis test (p-value marked on the graph) with Conover post-hoc test for group-to-group comparisons (A, C), Mann–Whitney U-test (B, D); line denotes significant difference between groups. LY—CD3/B220/NK1.1 for mouse cells, CD3/CD19/CD56 for human cells.