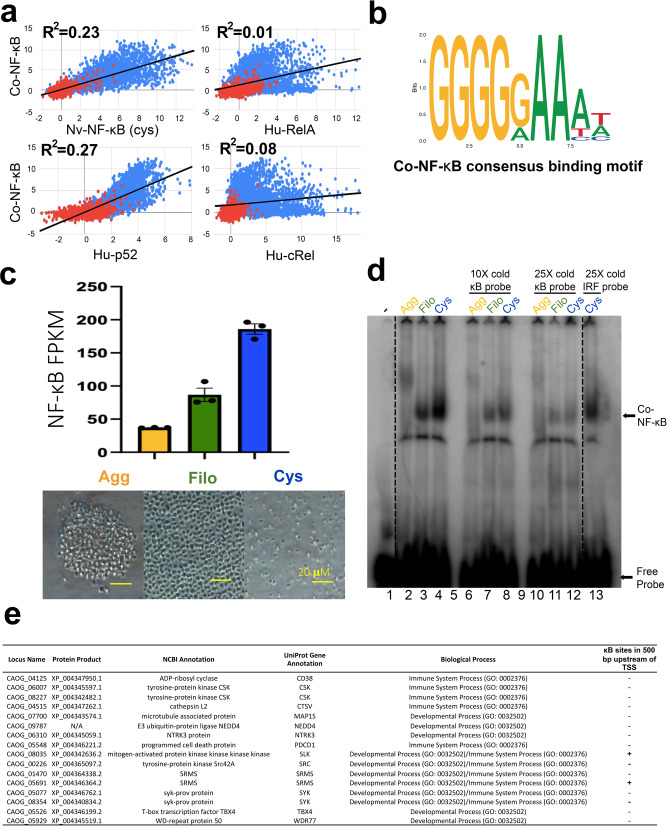
Fig. 5. NF-κB is differentially expressed during the different life stages of Capsaspora and has possible target genes involved in development and immunity.
a Protein binding microarray (PBM) DNA-binding profiles of Co-NF-κB as compared to Nematostella vectensis (Nv) NF-κB cysteine (cys) allele (top, left), human (Hu) RelA (top, right), human p52 (bottom, left), and human cRel (bottom, right). The axes are z-scores. Red dots represent random background sequences (n = 1159), and blue dots represent NF-κB binding sites (n = 2592). Black line is the best fit line (Co-NF-κB vs. the following: Nv-NF-κB, R2 = 0.23; Hu-p52, R2 = 0.27; Hu-cRel, R2 = 0.08; Hu-RelA, R2 = 0.01). b The consensus DNA-binding motif of Co-NF-κB generated from the PBM data in a. The motif was generated using the MEME motif discovery package42 using the 25 highest scoring binding sites identified by the PBM experiment in a. c Top: The FPKM values from Sebé-Pedrós et al.16 of NF-κB at each life stage, done in triplicate. Agg, Aggregative (yellow), Filo, Filopodic (green), Cys, Cystic (blue). Error bars are standard deviation. Bottom: Images taken with a light microscope of each life stage (Agg, Filo, and Cys from left to right). Yellow scale bar is 20 µm. Raw data are in Supplementary Data 5. d Capsaspora whole-cell extracts were created from each life stage (see Methods). 70 µg of each extract was then used in an electromobility shift assay, a palindromic κB-site probe (GGGAATTCCC). Lane 1 contains only free probe (-). Lanes 2-4 contain lysates from Agg, Filo, and Cys life stages incubated with a radioactive κB-site probe. Lanes 6–8, and lanes 10–12 contain lysates from Agg, Filo, and Cys life stages as indicated, and were incubated with an excess (10× and 25×, respectively) of unlabeled κB-site probe. Lane 13 contains the Cys lysate incubated with 25× unlabeled IRF-site probe. Lanes 5 and 9 contain no samples. NF-κB complexes and free probe are indicated with arrows. The dashed lines indicate where the image was cut to remove excess lanes. Raw image is in Supplementary Fig. 12. e The expression profiles of the indicated genes correlate with NF-κB mRNA expression in each life stage (Agg, low; Filo, medium; Cys, high), and were identified as developmental and immune system genes via Biological Processes GO analysis. Two of the genes in this list (SRMS and SLK) also contain κB sites in the 500 bp upstream of their TSS.

