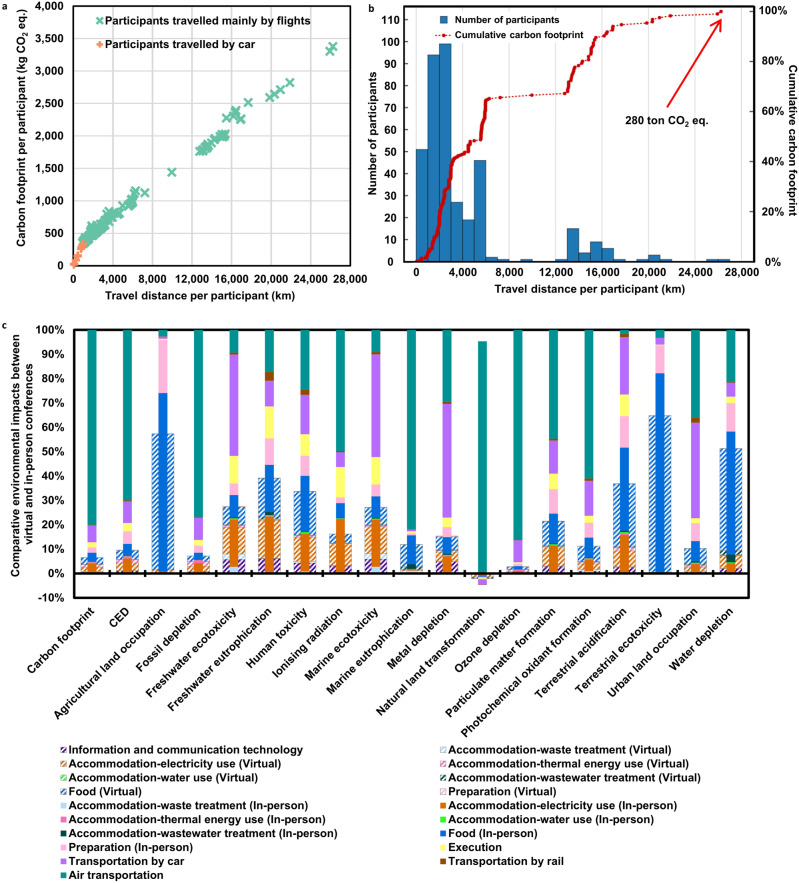
Fig. 2. Comparison between the 1-hub in-person conference and the virtual conference.
a Carbon footprint associated with transportation for individual participants, indicating that the per pkm carbon footprint for trips primarily by plane (slope of cyan dashed line) tends to be smaller than that for driving (slope of orange dashed line). b Cumulative carbon footprint for participants with increasing travel distances, showing that 50% of the greenhouse gas (GHG) emissions for all participants’ trips result from long-distance travels with a round-trip distance of over 10,000 km. c Environmental profiles of the virtual conference and in-person conference with only one hub, suggesting the environmental and energy sustainability of virtual conference in all impact categories. Colors represent different processes within the life cycle stages. Specifically, transitioning from in-person to virtual conferencing reduces the carbon footprint by 94% and cumulative energy demand (CED) by 90%. Among the impact categories at the midpoint level, air transportation dominates fossil depletion, marine eutrophication, natural land transformation, ozone depletion, and photochemical oxidant formation for the 1-hub in-person scenario. And food preparation, electricity consumption at home, and information communication technology (ICT) services contribute to the majority of each impact category for the baseline virtual scenario. Moreover, agricultural land occupation, terrestrial ecotoxicity, and water depletion are dominated by food preparation for both in-person and virtual conferences. CO2 eq., CO2 equivalent.

