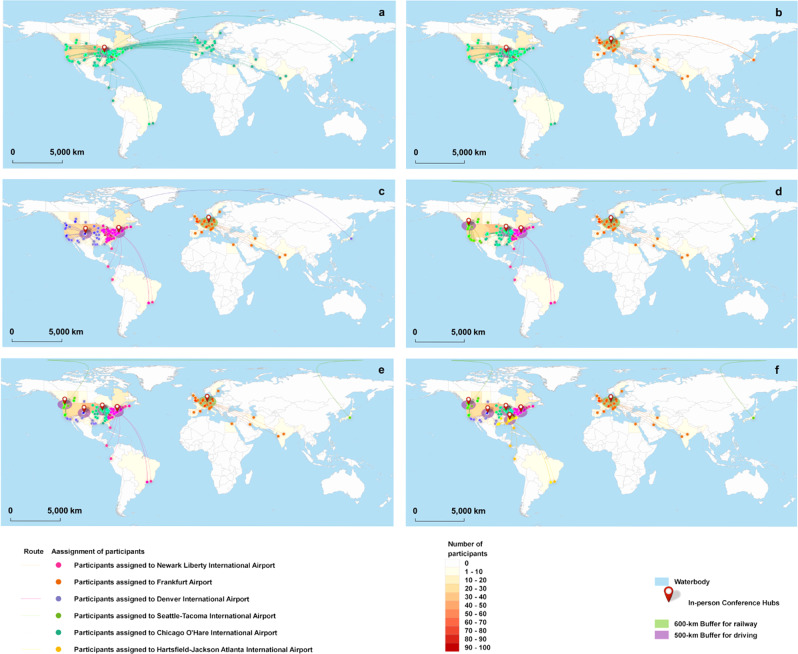
Fig. 3. Map of transportation routes and hub decisions for in-person scenarios.
a 1-hub in-person conference. b 2-hub in-person conference. c 3-hub in-person conference. d 4-hub in-person conference. e 5-hub in-person conference. f 6-hub in-person conference. Dots represent the origins of participants, and lines represent the route from their origins to their assigned conference hubs. Their colors indicate the assignments of participants to the conference hubs. Color scale shows the number of participants in each region around the world. These regions are divided according to the regional datasets for electricity production in Ecoinvent39.

