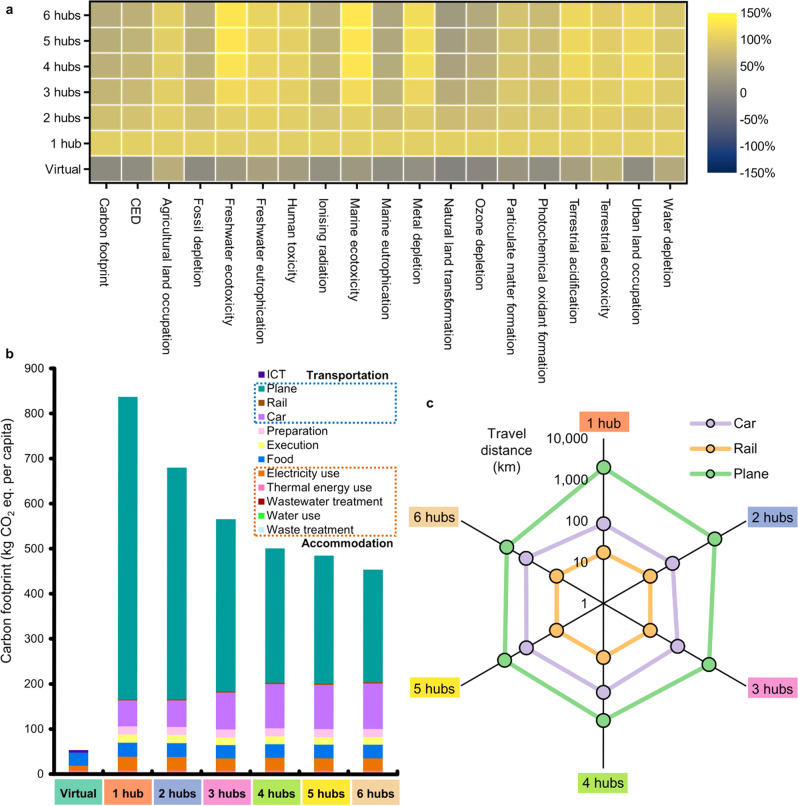
Fig. 4. Overall environmental sustainability of the virtual and in-person conferences.
a Carbon footprint, Cumulative energy demand (CED), and 17 ReCiPe midpoint indicators of the in-person scenarios, including the virtual conference and in-person conferences with 1 to 6 hubs, for an average participant. Colors indicate the intensity levels of environmental impacts. b Breakdowns of carbon footprint per participant for the in-person scenarios. Colors represent different processes within the life cycle stages. c Average travel distances by transportation mode on a logarithmic scale for the in-person scenarios with 1 to 6 hubs. CO2 eq., CO2 equivalent.

