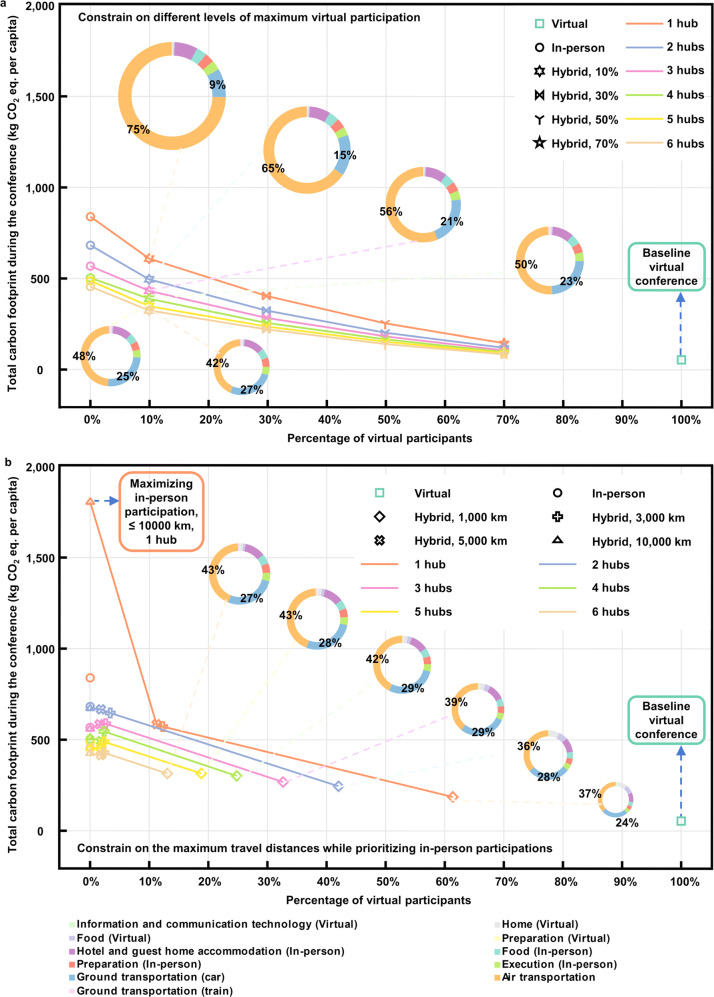
Fig. 5. Trade-offs between face-to-face communication and carbon footprint.
Different markers indicate the results of different scenarios, and their colors refer to the number of conference hubs. Doughnut charts represent the breakdowns of scenarios, pointed by the blue dashed lines. a Comparison between the hybrid scenarios with a constraint of the maximum virtual participation, the in-person scenarios, and the baseline virtual scenario. b Comparison between the hybrid scenarios with a constraint of the maximum travel distance, the in-person scenarios, and the baseline virtual scenario. CO2 eq., CO2 equivalent.

