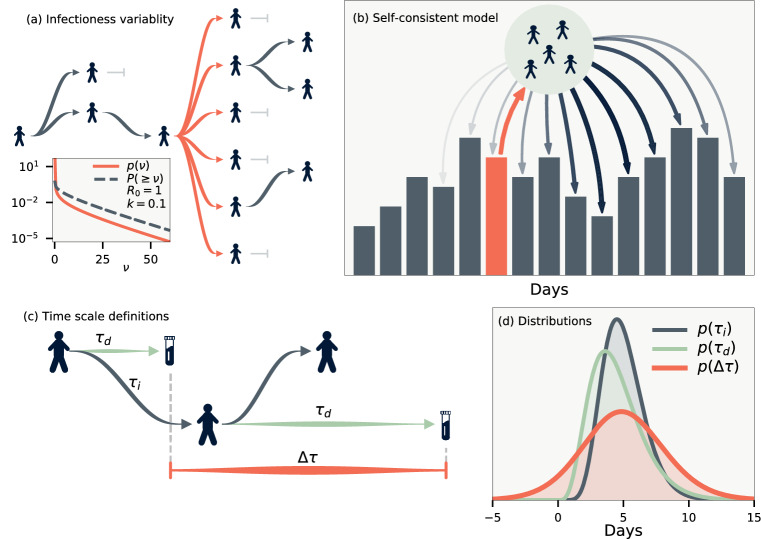
Figure 1.
Model definitions. (a) Illustration of a heterogeneous infection pattern (superspreading). Inset shows the probability density function and (one minus) the cumulative probability for the gamma distribution . (b) Likelihood model. The infected individuals whose infection was reported on some day (orange) will themselves infect a number of people. These are in turn detected on other days according to the distribution . (c) Time scale definitions. denotes the duration from being infected to being reported, and the duration between infections (generation time). Finally, is the difference between the reported times of infector-infectee pairs. (d) The maximum likelihood of the distributions we employ for and , and the distribution thus implied for . has support below zero as it is possible that the infector’s infection is reported after the infectee.

