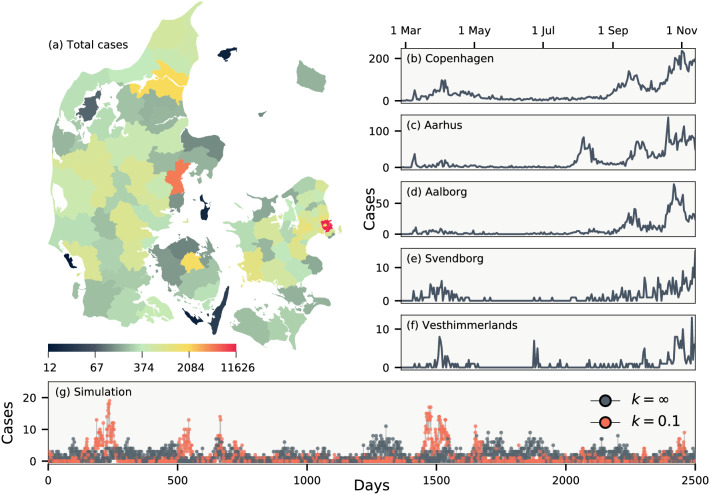
Figure 2.
Daily cases of COVID-19 in Denmark between 26 February and 17 November 2020, during which only PCR tests were employed. (a) The total number of cases in each of Denmark’s 98 municipalities. (b–f) Daily number of cases in five municipalities. (g) Simulations of an epidemic with dispersion parameter and , respectively. Both simulations use and a crossing parameter chosen such that on average an infectious person enters every fifth day. Map created from DAGI [“Danmarks Administrative Geografiske Inddeling”] data (2020) supplied by the Danish Agency for Data Supply and Efficiency.

