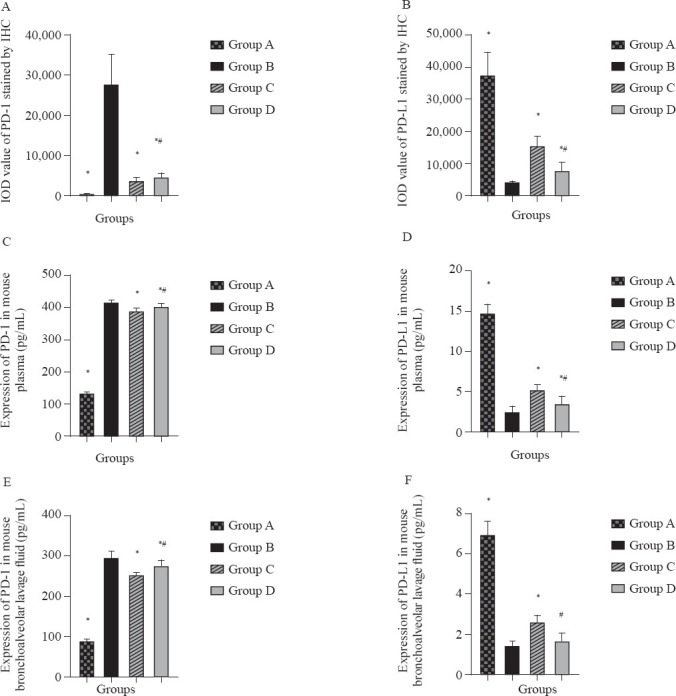
Figure 3.

Expression of PD-1 and PD-L1 in plasma and BLF. Compared with group B, *P<0.05; compared with group C, #P<0.05. Group A: normal group; group B: COPD model group; group C: Maxingloushi decoction + COPD group; group D: PD-1 inhibitor + COPD group; IOD: immuno-fluorescence optical density; IHC: immunohistochemistry; PD-1: programmed death-1; PD-L1: programmed death-ligand 1.
