Figure 8.
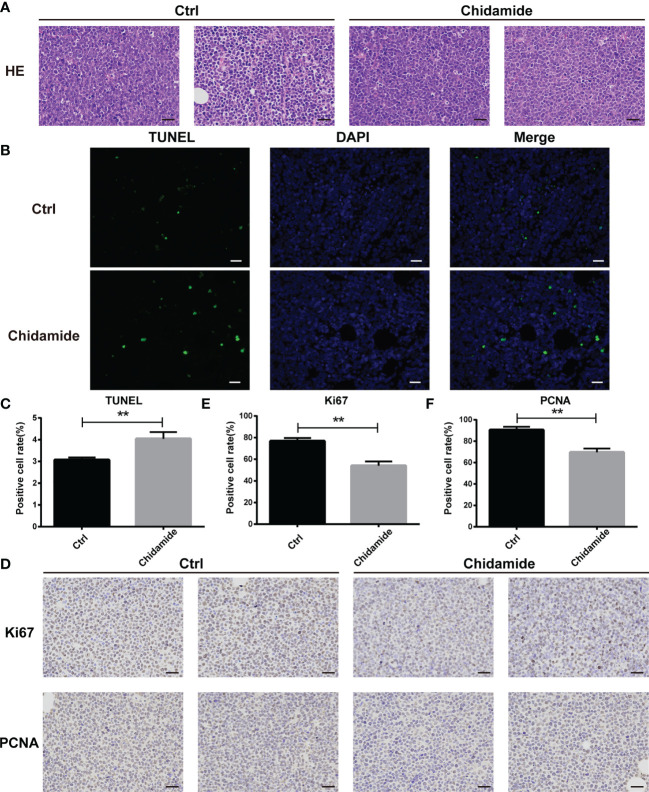
Inhibition of tumor growth in vivo by chidamide. (A) Tumor samples collected after treatment with vehicle/control or chidamide were fixed, sliced and stained with H&E. (B) Representative images of immunofluorescent TUNEL staining performed on serial sections of the tumors are shown; the corresponding statistical results are shown in (C). Images were acquired under a Nikon microscope (original magnification, ×400). (D) The expression levels of Ki67 and PCNA were detected by immunohistochemical staining. (E, F) Data represent three independent experiments, and are mean ± S.D. (**p < 0.01).

