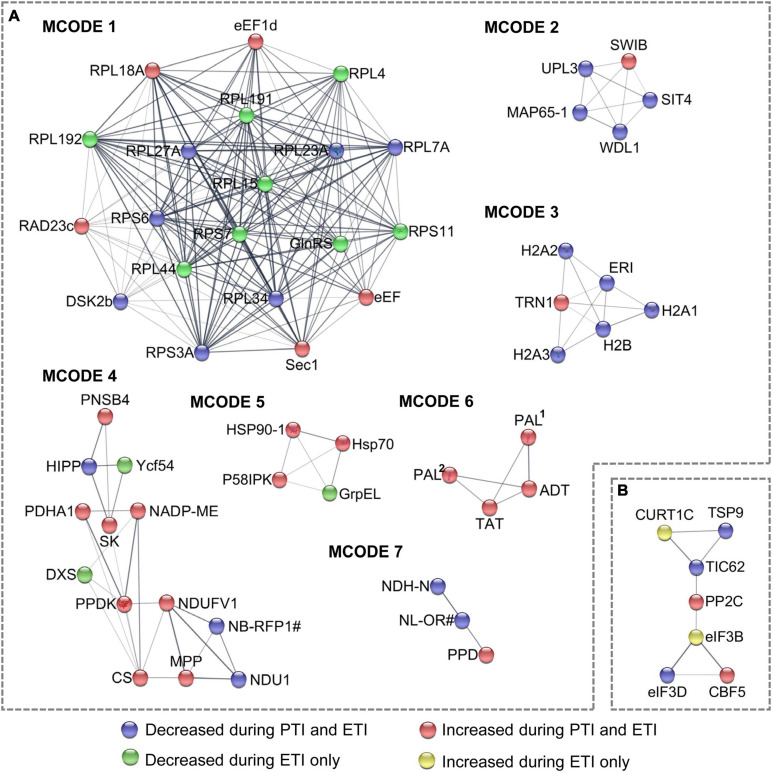
FIGURE 3.
Subnet module analysis of the protein-protein interaction (PPI) network. (A) DR proteins; and (B) DR phosphoproteins. Different colors of the nodes correspond to the Clusters in Figure 1C, which represent different change patterns of the DR proteins and phosphoproteins, as shown at the bottom of the figure. refer to Supplementary Tables 2, 3 for abbreviations.

