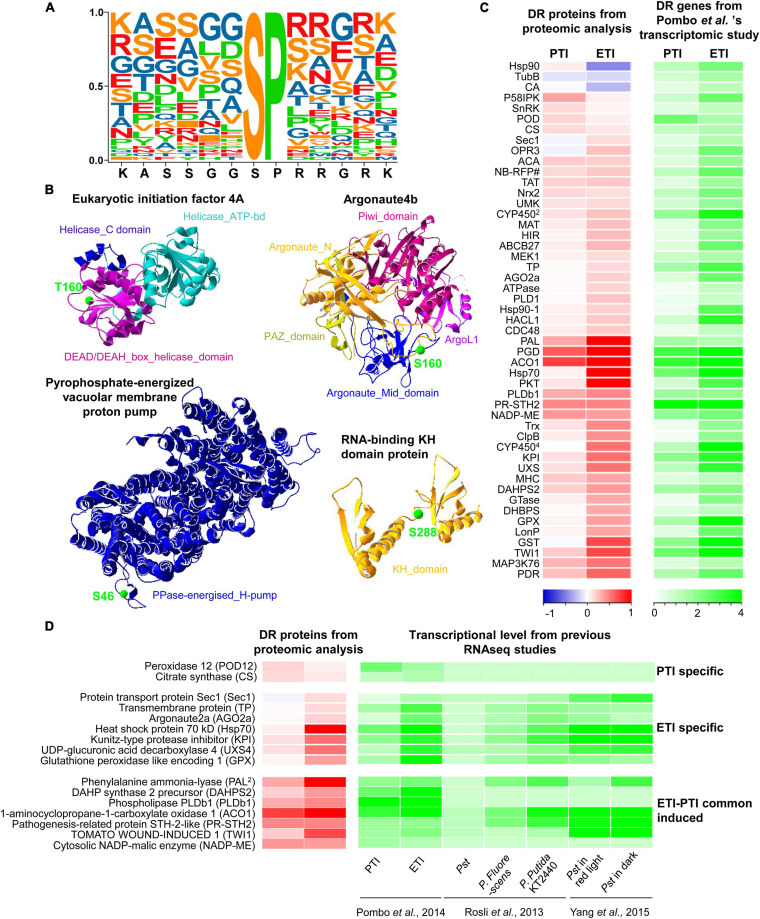
FIGURE 4.
Extracted motifs and predicted 3D structures of DR phosphoproteins, as well as integrative analysis of proteome and transcriptome. (A) A motif extracted from 41 DR phosphosites. (B) 3D structures of four DR phosphoproteins. More detailed information can be found in Supplementary Table 8. (C) Heatmap of DR proteins with relative changes at the protein level and transcript level from Pombo et al. ’s transcriptomic study. The two columns represent different treatments of PTI and ETI. The rows represent individual proteins. The detailed information is listed in Supplementary Table 9. The increased or decreased proteins are indicated in red or blue, respectively, and the increased gene transcripts are shown in green. The log2 ratios of fold-change levels of proteins or transcripts are indicated at the bottom. (D) Heatmap of DR proteins with conserved changes at the protein level and transcript level from multiple RNA-seq studies. The increased or decreased proteins are indicated in red or blue, respectively, and the increased gene transcripts are shown in green.

