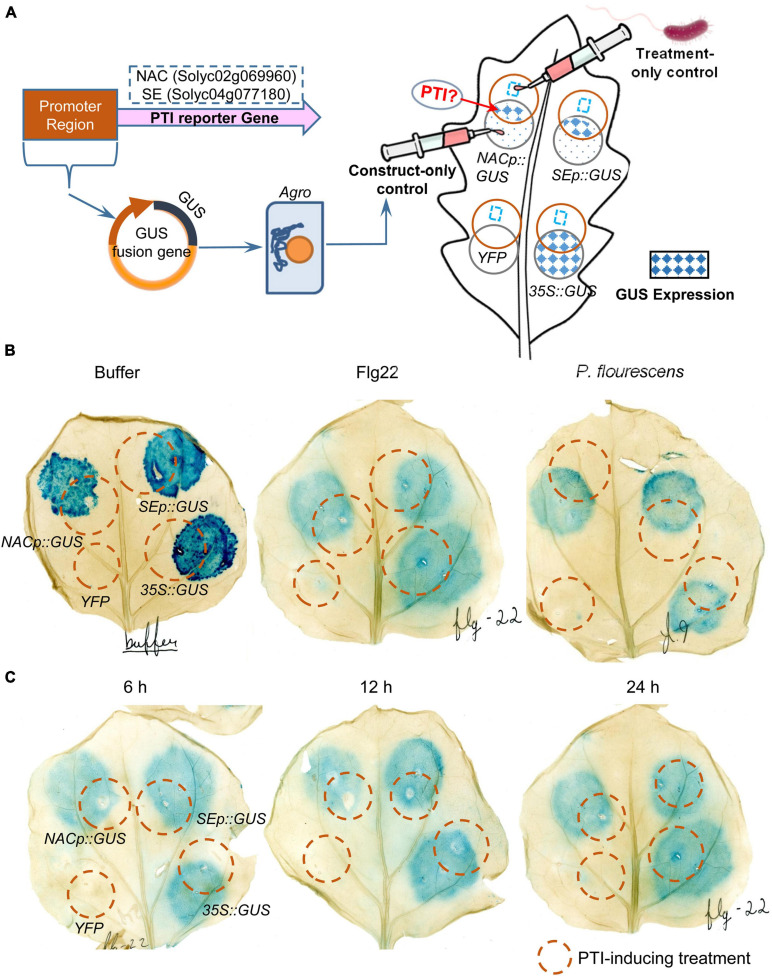
FIGURE 6.
Transient expression assays of NAC and SE genes in N. benthamiana leaves in response to different PTI-inducing treatments at different time-points. (A) Schematic workflow of the assay and interpretation of the “overlapping circle” pattern permitted for a qualitative analysis of the GUS histochemical stain. Each leaf was infiltrated with four agrobacterium constructs: YFP (negative control), 35S:GUS (positive control), NACp:GUS and SEp:GUS; (B) N. benthamiana leaves treated with negative control buffer, flg22, and P. fluorescens for 12 h and then GUS staining for 16 h; and (C) N. benthamiana leaves treated with flg22 for 6, 12, and 24 h and then GUS staining for 16 h.

