
FIG 2.
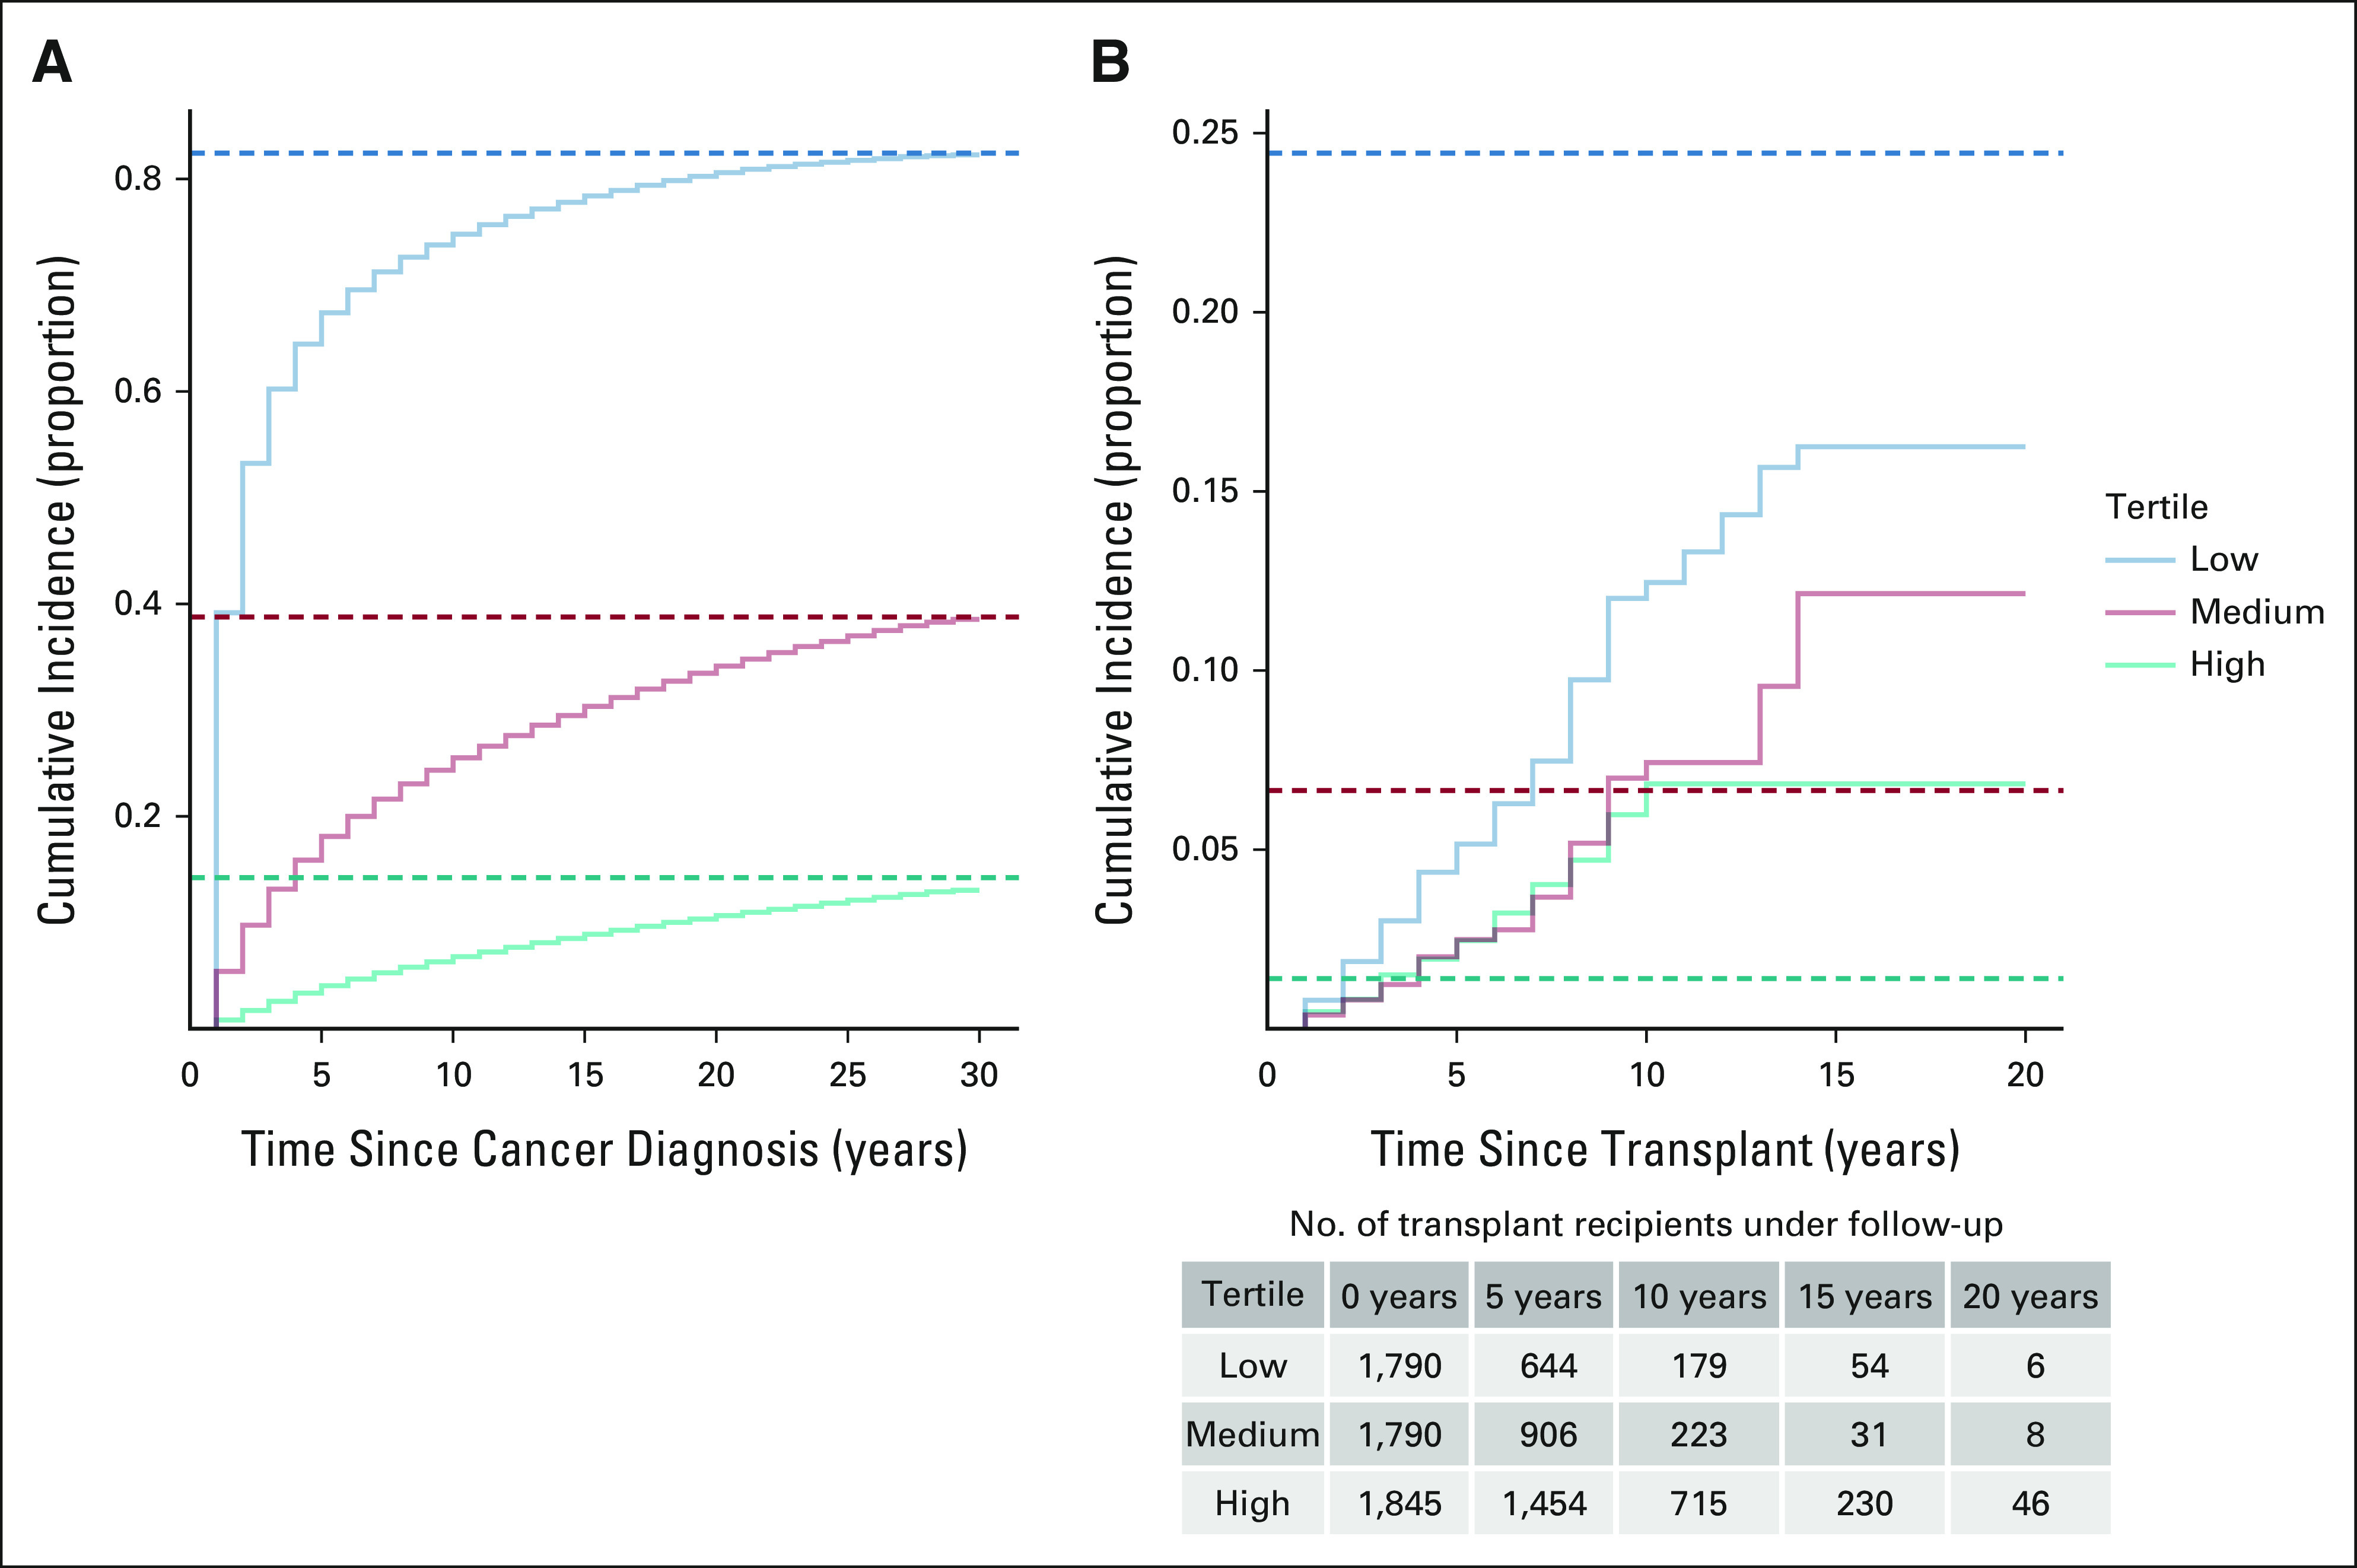
Observed and predicted cumulative incidence of cancer-specific mortality among patients with cancer. The observed results are shown as Kaplan-Meier curves, and the predicted results are shown as horizontal dashed lines calculated as 1 minus the mean cure probability from the cure models. (A) The results are shown for patients with cancer in the general population for tertiles on the basis of the predicted cure probability at cancer diagnosis. (B) The results are shown for transplanted patients with cancer on the basis of the predicted cure probability at the time of transplantation. Note that the vertical axes differ in the two panels.