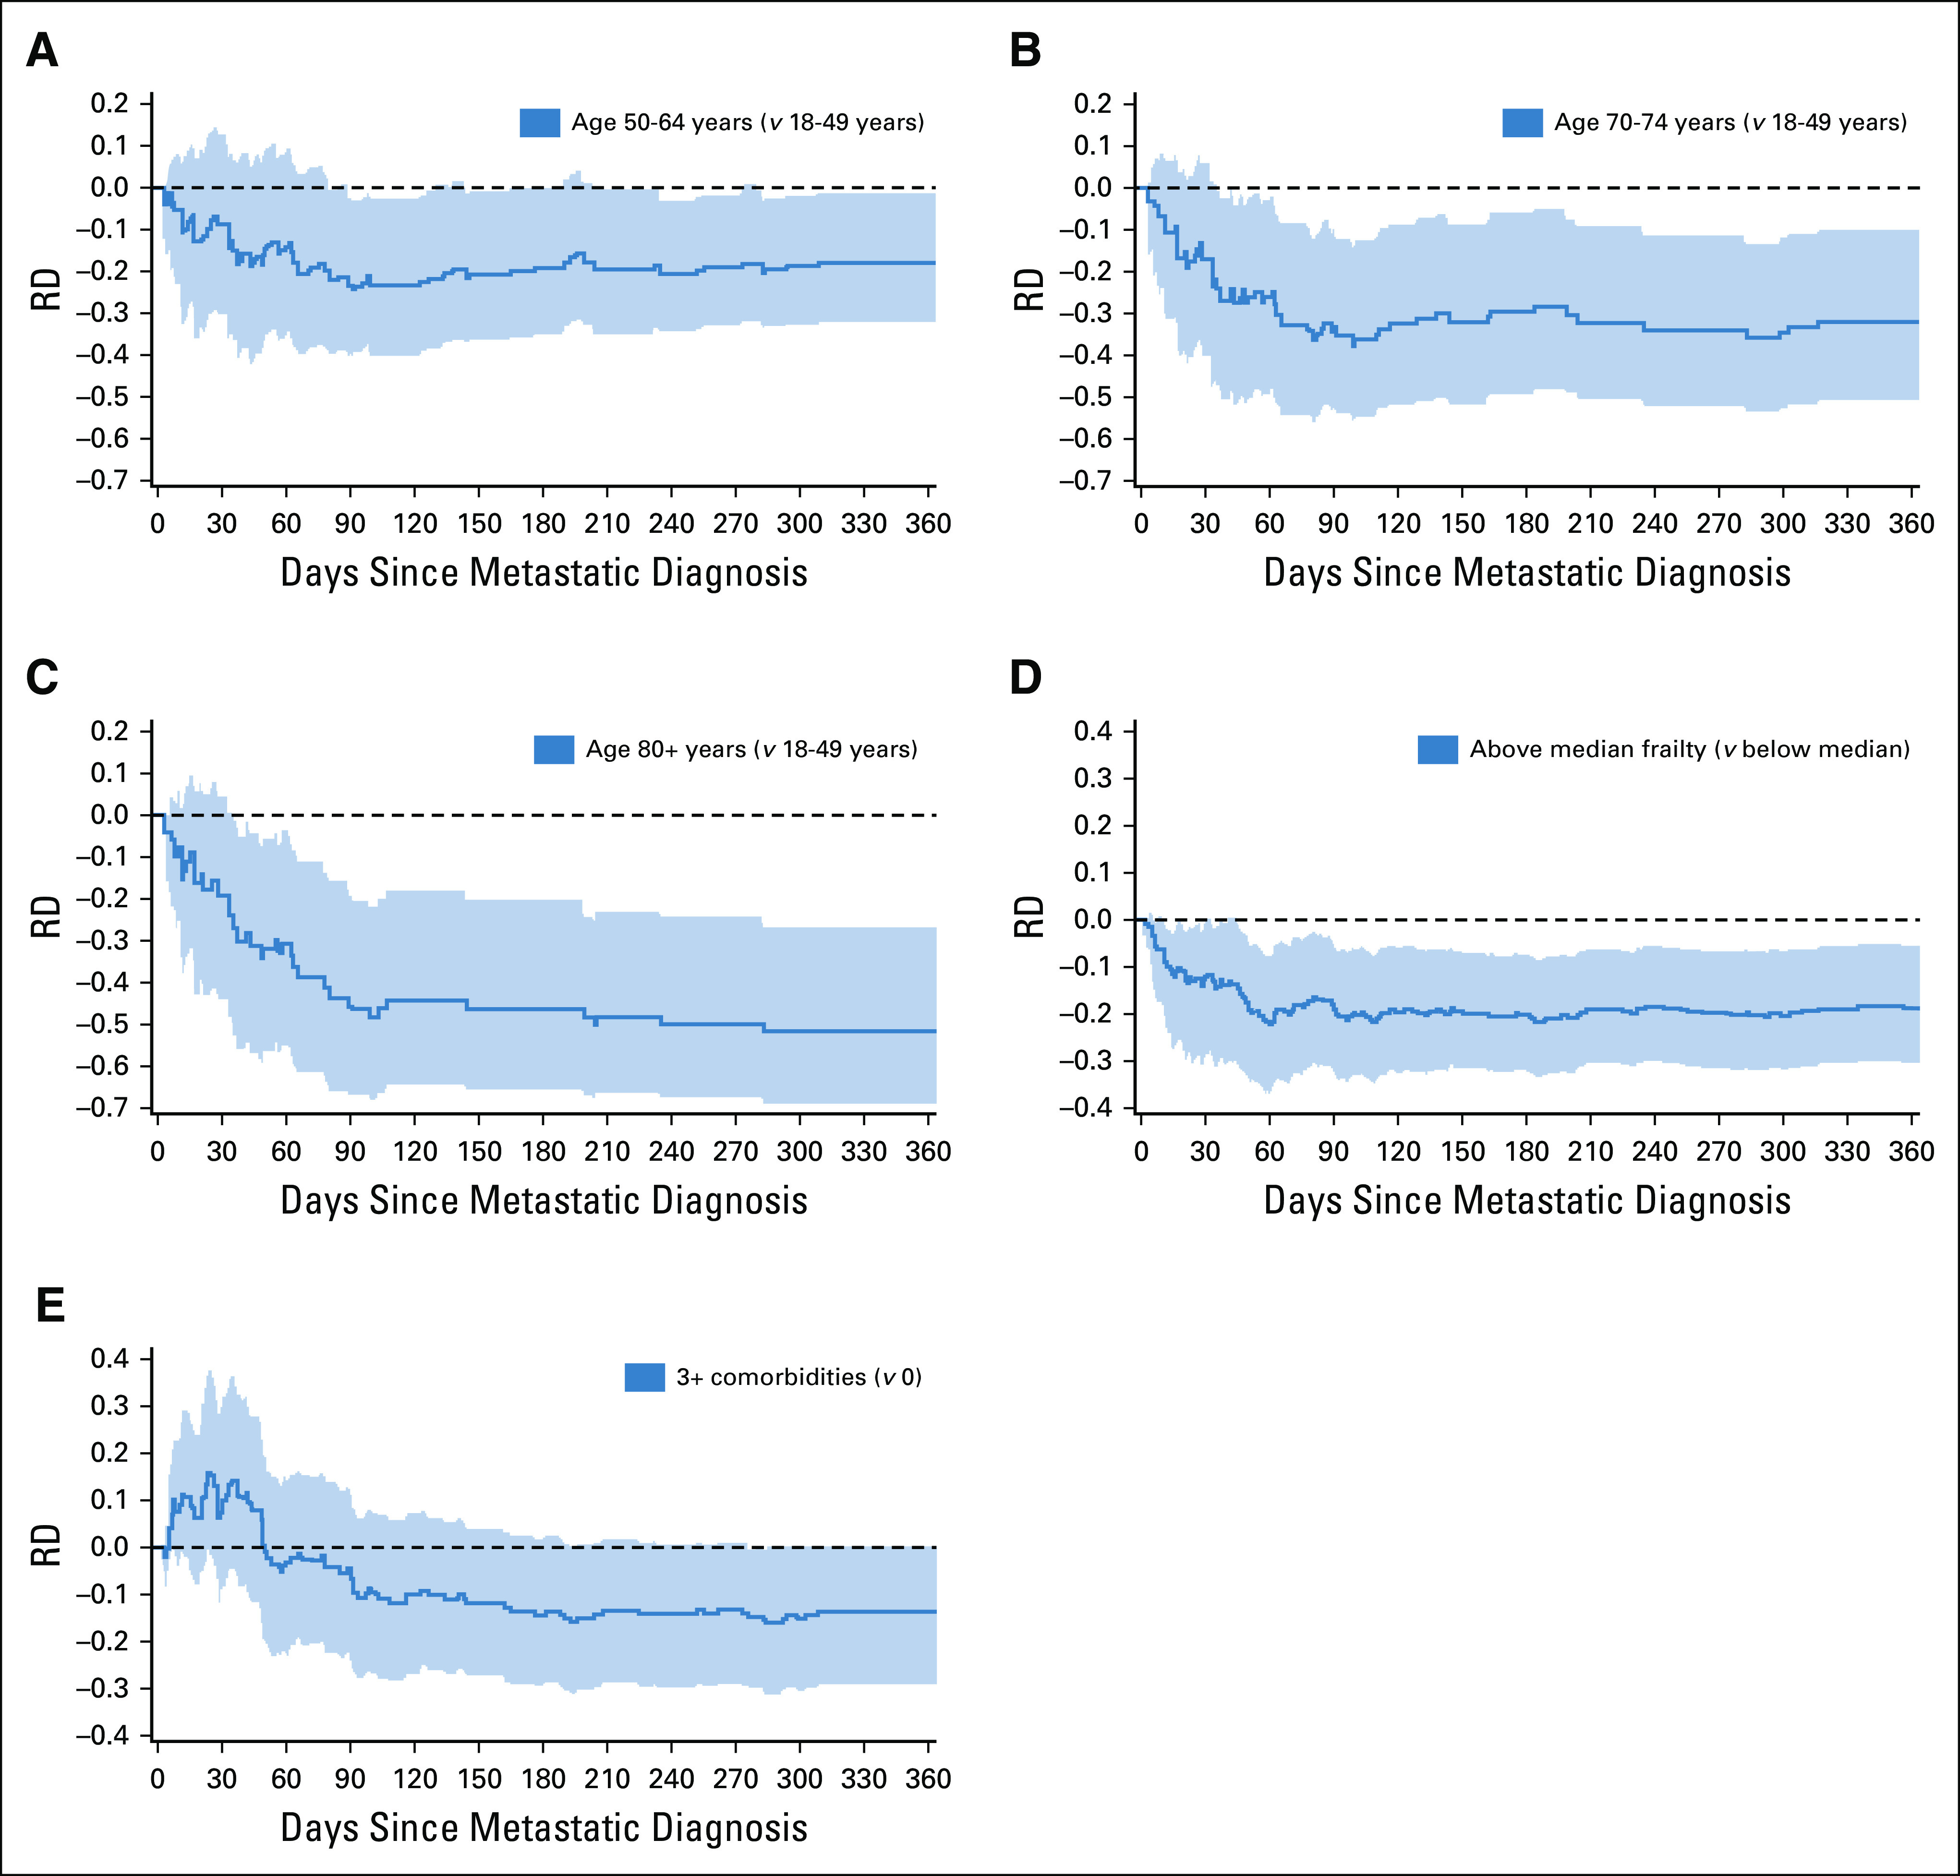
FIG 2.

RDs in OAA utilization in 12 months following metastatic RCC for age (A-C), frailty (D), and comorbid conditions (E). Curves below the dotted reference line indicate that the comparison group has lower OAA utilization. Black dashed lines represent the RDs, and shaded areas represent 95% CIs (on the basis of 2,000 bootstraps). OAA, oral anticancer agent; RCC, renal cell carcinoma; RD, risk difference.
