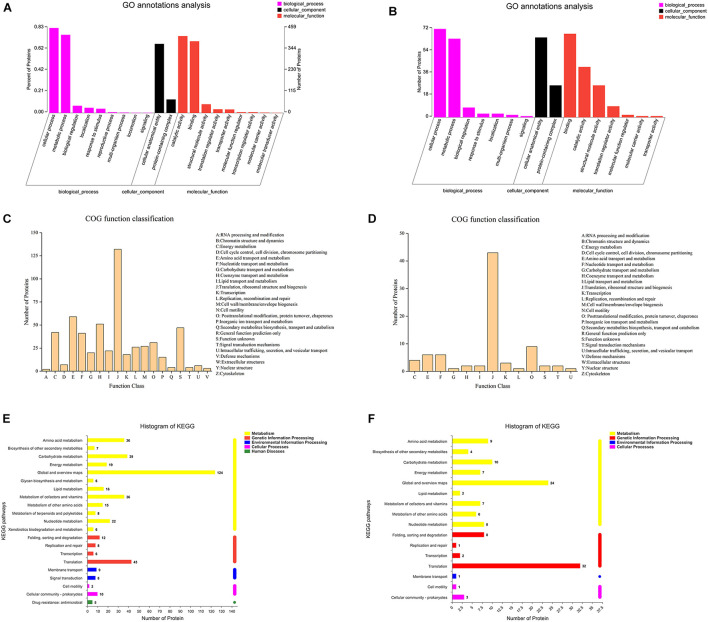
FIGURE 4.
GO annotation analysis of the intracellular (A) and extracellular (B) differentially expressed proteins in 00A vs. 00B. COG terms of the intracellular (C) and extracellular (D) differentially expressed proteins in 00A vs. 00B. KEGG pathway analysis of the intracellular (E) and extracellular (F) differentially expressed proteins in 00A vs. 00B.

