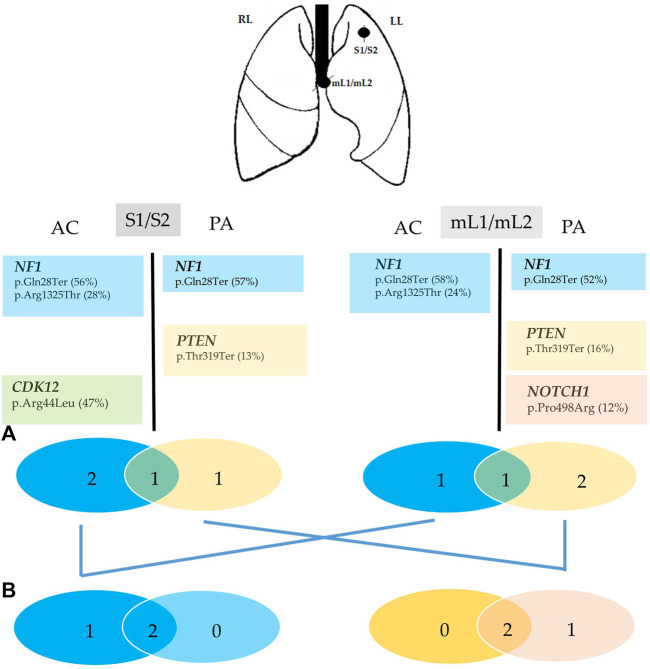
FIGURE 5.
Summary of the genomic findings of Case 2. Genes with mutations identified in each tumor entity of the superior left lung (S1/S2) and hilar lymphnode metastasis are listed as symbol and aminoacidic changes (% mutant allele fraction). The Venn diagrams (A) were used to show the relationship of somatic mutations between the S1 (blue circle) and S2 (yellow circle), nL1 (blue circle) and mL2 (yellow circle) in the patient. The number represents the somatic mutations identified in the corresponding samples, and the numbers in the overlapped green regions are the ubiquitous somatic mutations between the two concurrent tumor components (S1/S2, mL1/mL2) in the same patient. The Venn diagrams (B) were used to show the relationship of somatic mutations between the carcinoid component of S1 and between the adenocarcinoma component of S2 and mL2. The numbers represent the somatic mutations identified in the corresponding samples, and the numbers in the overlapped regions are ubiquitous somatic mutations shared by the components with the same histology in primary and metastatic sites.S1/S2, mixed carcinoid/adenocarcinoma tumor of the superior lung; mL1/mL2, mixed carcinoid/adenocarcinoma hilar lymphnode metatsasis. LL, left lung; RL, right lung. AC, atypicalcarcinoid; PA, pulmonary adenocarcinoma.

