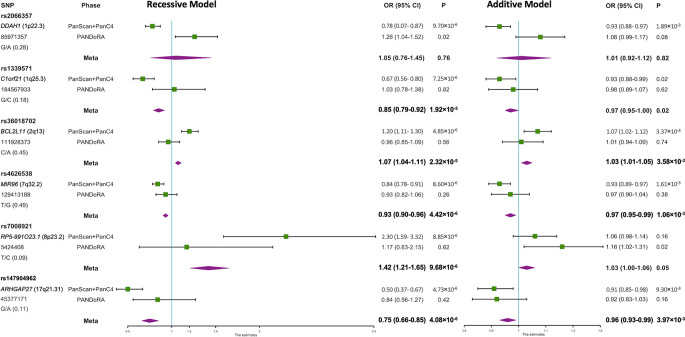
Figure 1.
Forest plot of the associations of the 6 SNPs with PDAC risk under recessive and additive genetic models. A forest plot for the 6 SNPs and risk of PDAC is shown by two genetic models using data from discovery and replication analyses combined. Population specific odds ratios (OR) and 95% confidence intervals (CI) are denoted by green boxes and black lines. The combined OR estimates are represented by purple diamonds, where diamond width corresponds to 95% CI bounds. The position information (hg38) and minor allele frequency (MAF) for each SNP are shown on the left.

