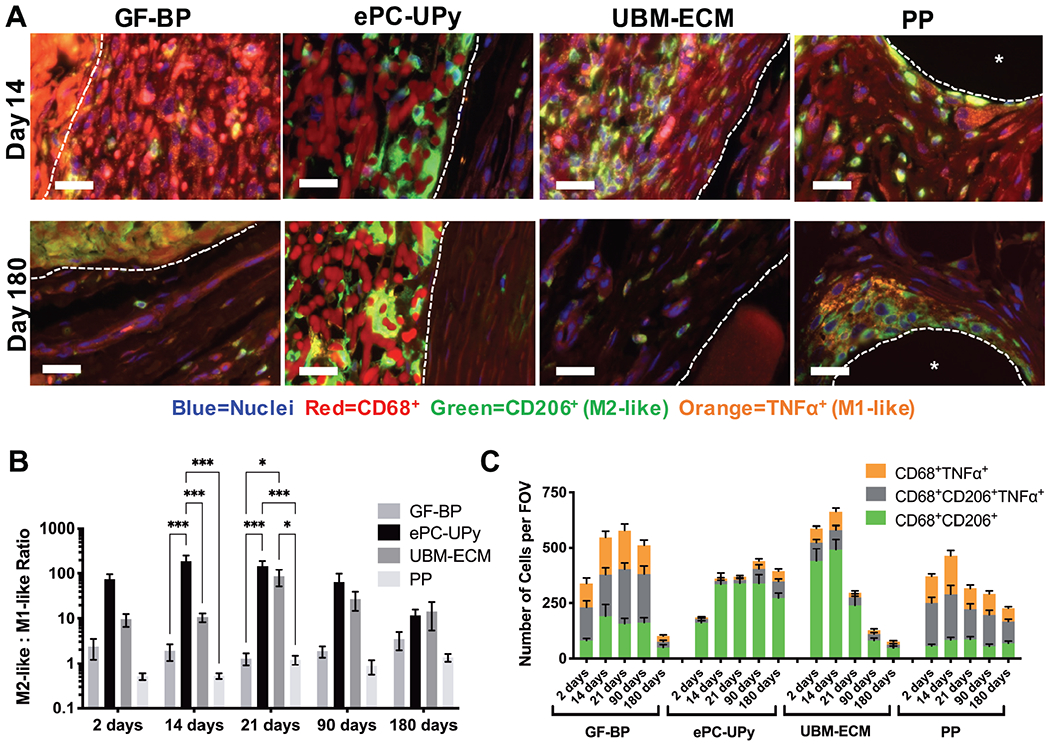
Figure 3. Macrophage response to GF-BP, ePC-UPy, UBM-ECM and PP.

(A) Representative images of immunolabeling of pan-macrophages (CD68+, red), pro-remodeling M2-like macrophages (CD206+, green) and pro-inflammatory M1-like macrophages (TNFα+, orange) at the 14 and 180 day timepoint. Scale bars 25um, dotted lines define the interface of the material, asterisk shows PP fiber. Biomaterial autofluorescence was not counted during quantification due to lack of co-localization with nuclei. (B) Quantification of the ratio of M2-like: M1-like (CD68+CD206+: CD68+TNFα+) macrophages. Axis in log scale. (C) Quantification of the number of CD68+CD206+, CD68+CD206+TNFα+, and CD68+TNFα+ macrophages per field of view. Macrophage immunolabeling indicates a dominant and sustained M2-like phenotype in response to the ePC-UPy material.
