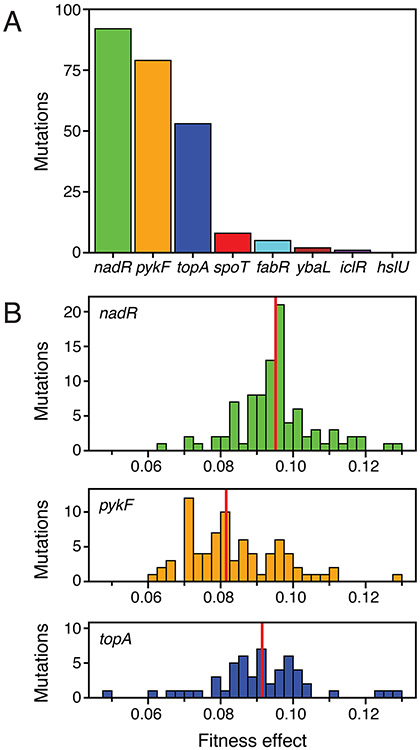
Figure 4. Characteristics of beneficial mutations in the initial selective sweep.
(A) Total number of beneficial mutations in each of the eight targeted genes for which fitness effects could be estimated by analyzing their frequency trajectories between generations 163 and 243. (B) Distributions of fitness effects of beneficial mutations in the three genes that were the dominant targets of selection. Mutations are binned by the maximum likelihood estimates of their fitness effects. Vertical red lines show the mean of each distribution. 95% confidence limits in Figure 6A show uncertainty in the fitness effect estimated for each of these mutations.

