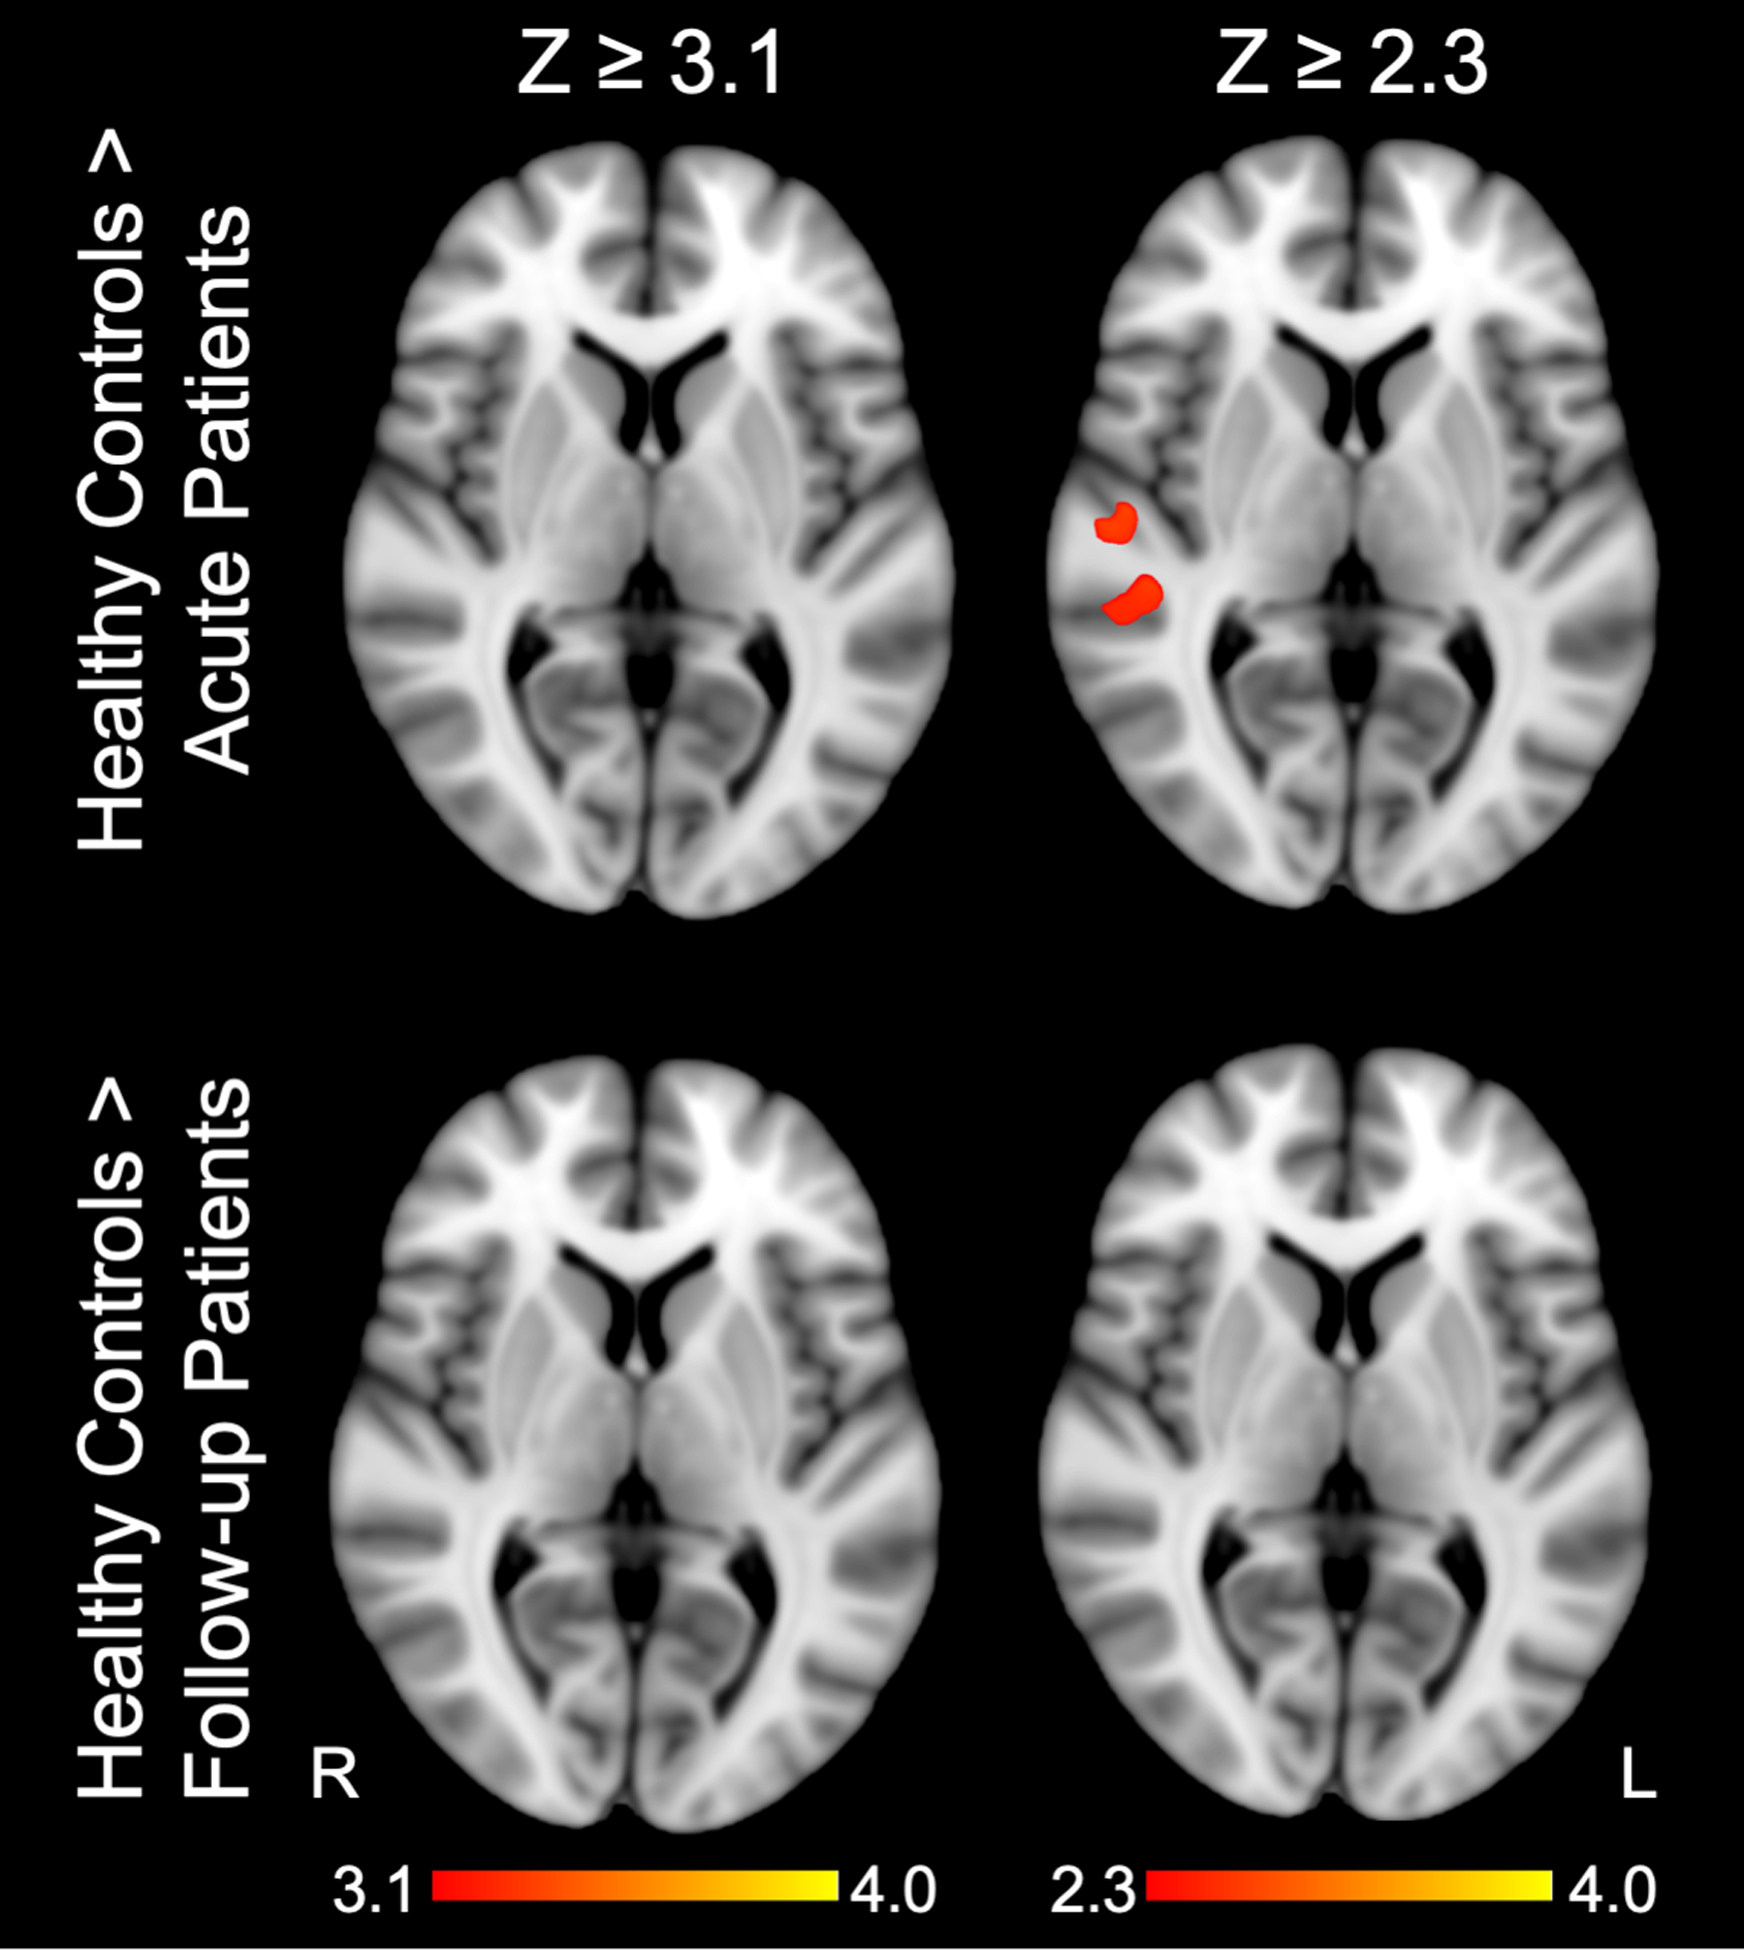
Fig. 5 -. Regions for which fMRI responses to language stimuli are greater in healthy control subjects than patients acutely and at follow-up.

Z-statistic maps cluster-thresholded at Z ≥ 3.1 and Z ≥ 2.3. See Supplemental Materials; Table S4 for local maxima coordinates and Harvard-Oxford Cortical Atlas labels. Z = Z-score.
