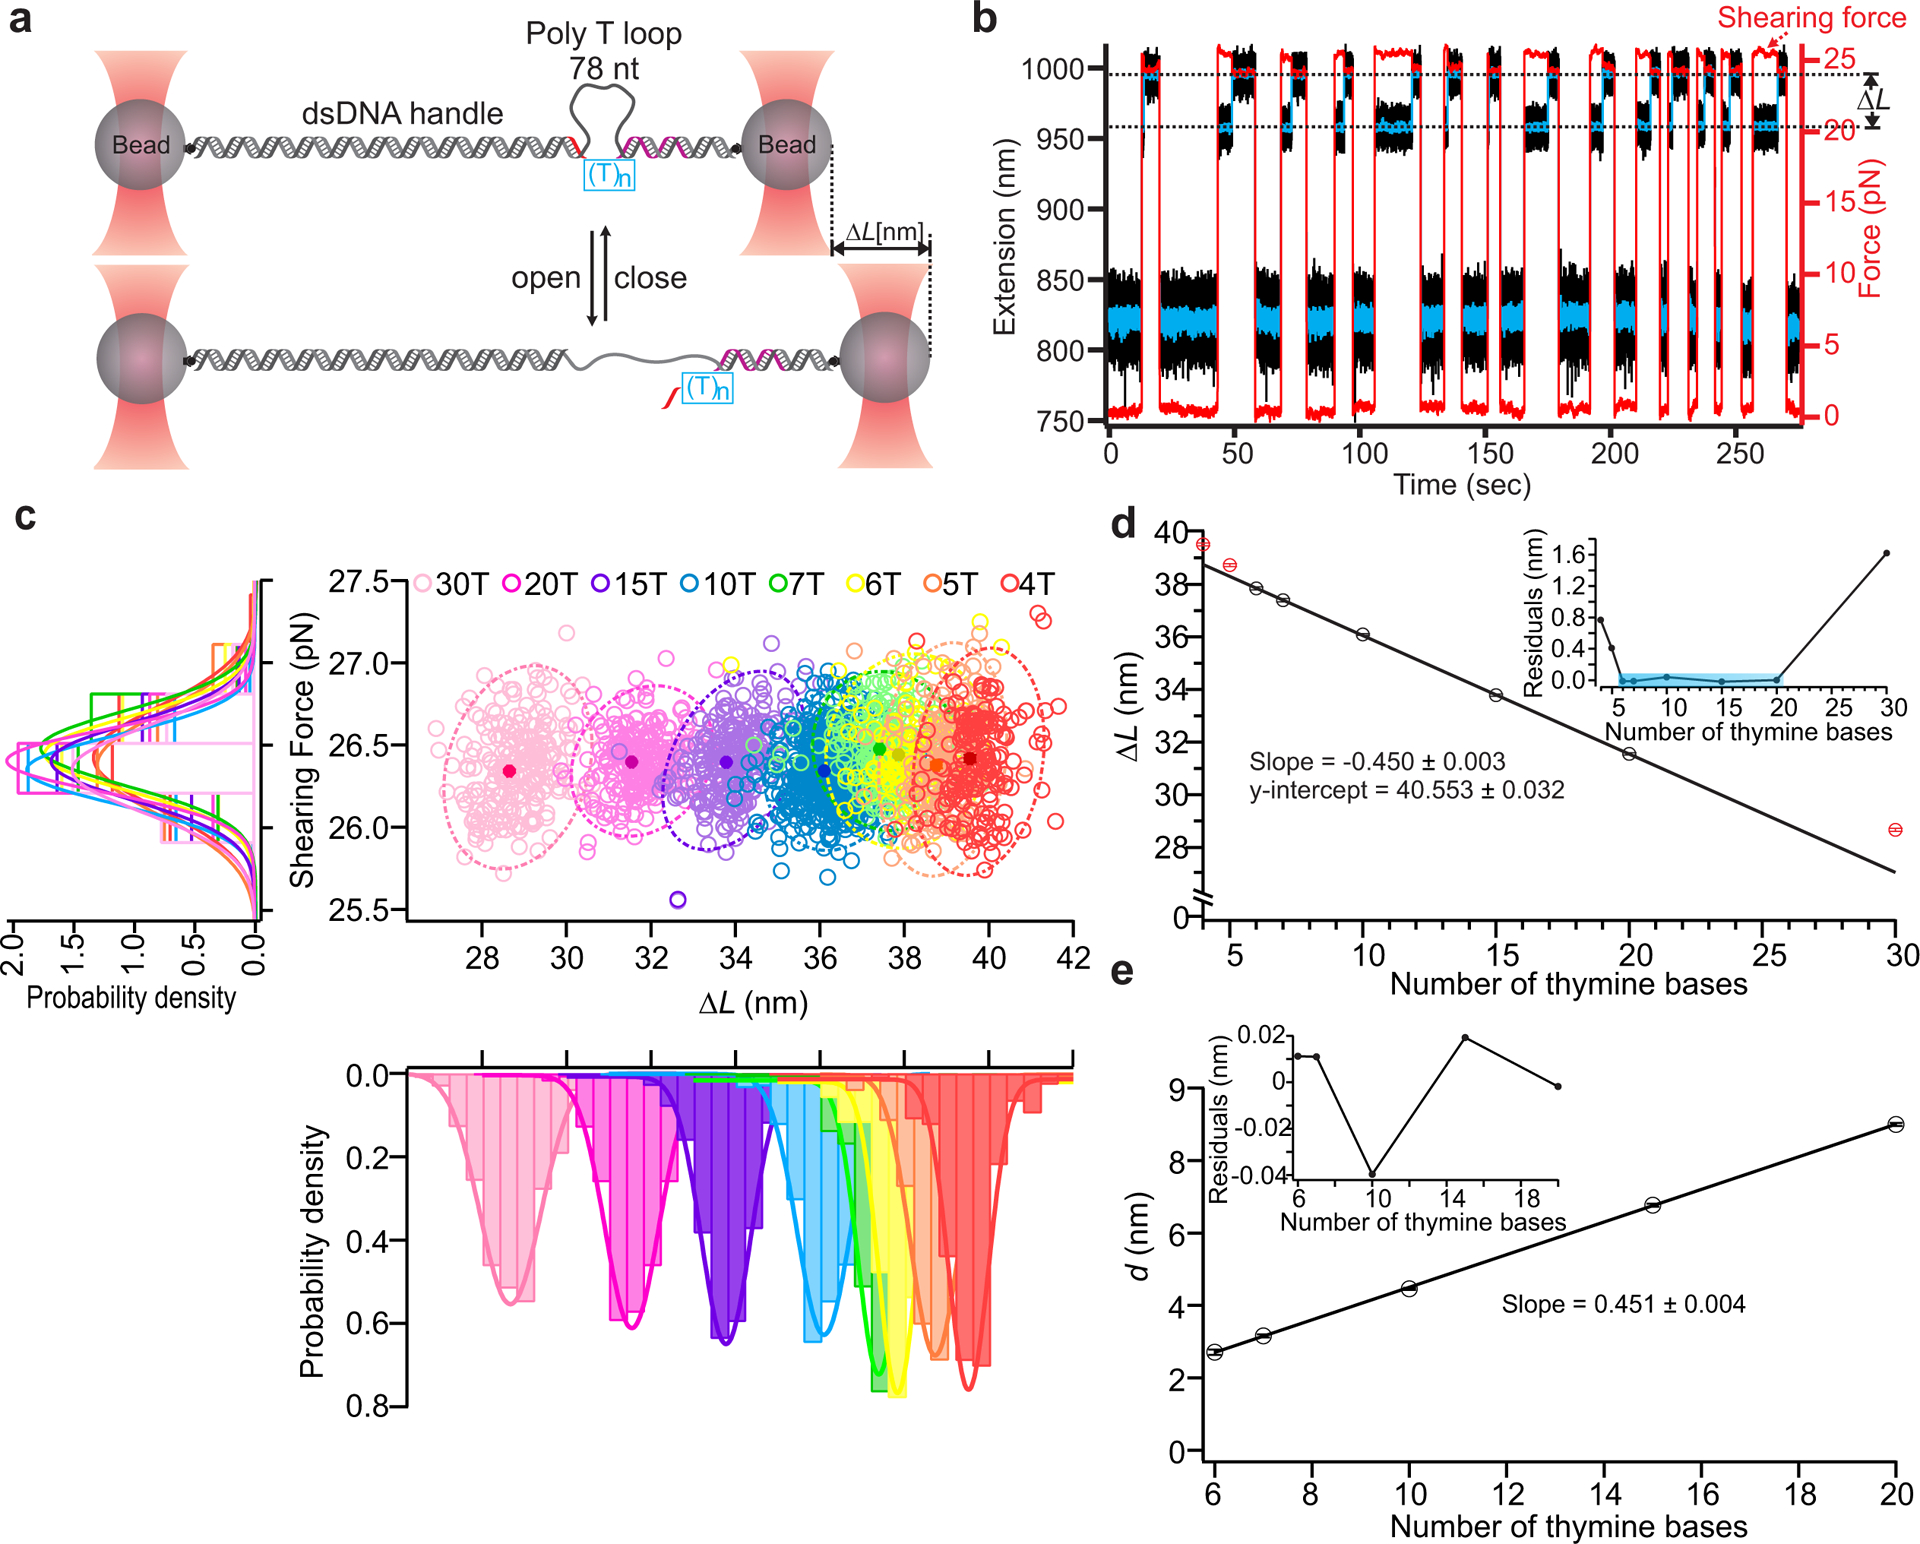
Fig. 2. Characterization of DNA Nanoswitch Calipers (DNCs) with ssDNA targets.

a, Calipers are stretched between two optically trapped beads and actuated by force to measure the lengths of ssDNA targets (see method). The long, mechanically strong handle (purple) and short, mechanically weak handle (red) on the opposite ends of (T)n bridges (blue box) hybridize with the caliper to form the loop (78 thymine bases). During each measurement cycle, the force switches between a low force (~0 pN) that enables rebinding of the short handle and a higher force (~26 pN) that initiates unbinding of this handle. b, Typical trajectories of force (red trace) and extension (black trace with blue trace representing data smoothed by sliding window averaging of 10) during multiple cycles of force actuation. c, Distribution analysis of the change-in-length (ΔL) during loop opening at the specific shearing force (~26 pN). Scatter plots of shearing force versus ΔL for different lengths of ssDNA targets are presented with 95% confidence ellipses superimposed (dotted lines); peak values are presented as solid circles with localization accuracy in shearing force and ΔL represented by the width in each dimension (middle panel). Histograms of the shearing force (left panel), and change-in-length (ΔL) (lower panel) for all the ssDNA targets are also presented with Gaussian fits superimposed. The number of data points in each target ranges between 126 and 622 across multiple molecules (Supplementary Table 3). d, Correlation plot of mean ΔL vs. number of thymine bases using results of Gaussian fits; a linear fit over the range of 6–20 bases is superimposed (R2 = 0.9999). The excluded points are indicated in red. Inset depicts residuals of the linear fit. e, Transformation of mean ΔL measurements within the fitting range to absolute distances measurements (d) by subtraction of the offset. Inset shows residuals in this range, which are all less than 50 picometers. Error bars represent the calculated standard error of the mean.
