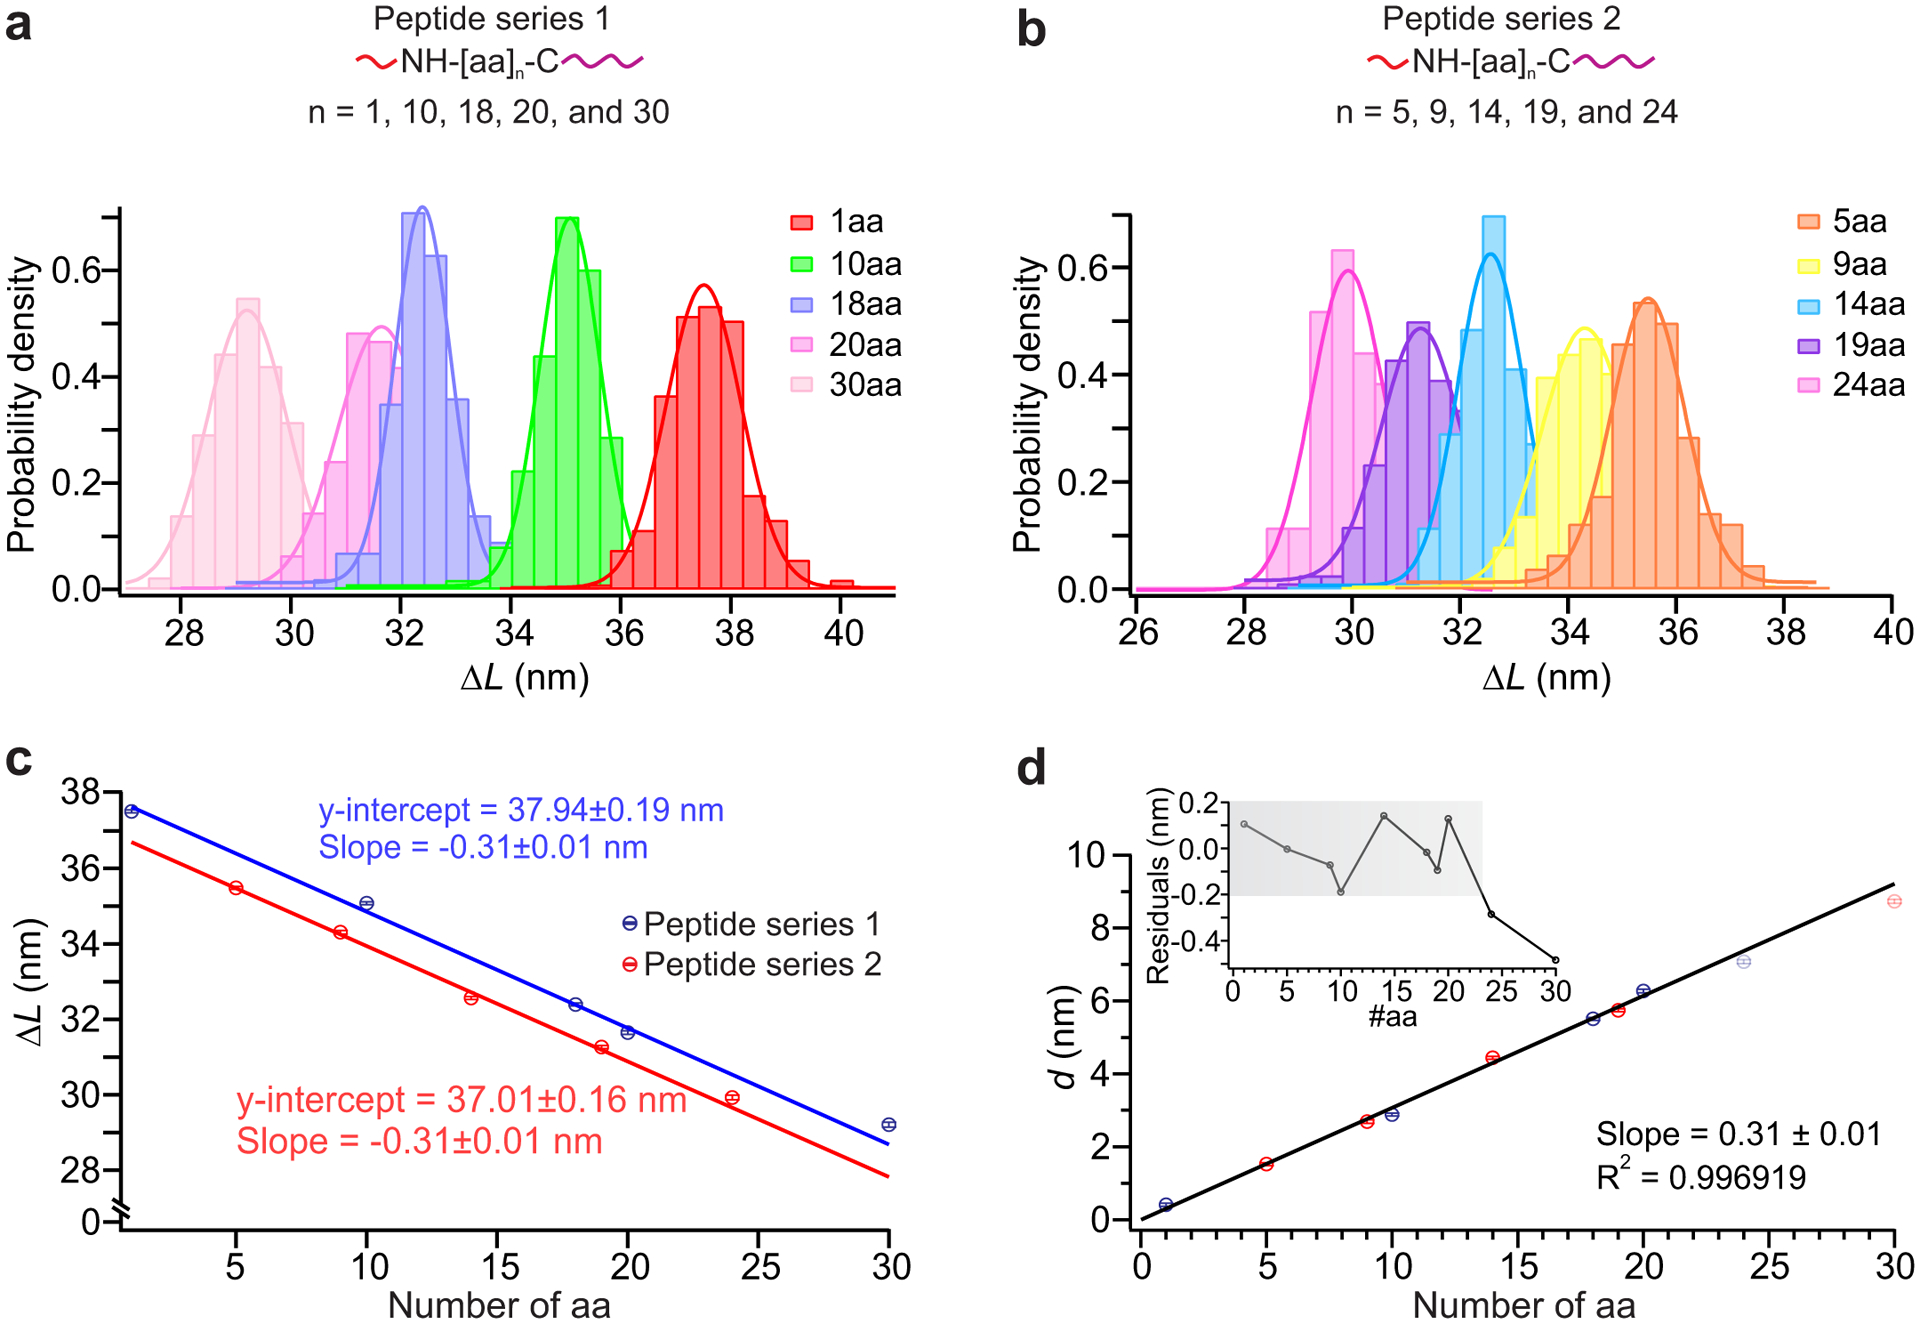
Fig. 3. Calibration of DNA Nanoswitch Calipers (DNC) for peptide targets.

a, and b, Top panels: measurement of distances for peptides of varying lengths for peptide series 1 (a) and peptide series 2 (b) (Supplementary Table 2); each short, mechanically weak handle (red) is attached to the amino group of the N terminus and each long, mechanically strong handle (purple) is attached to the sulfhydryl group of the cysteine residue at the C terminus. The number of data points in each target ranges between 131 and 668 across multiple molecules (Supplementary Table 4). Bottom panels: histograms of the change-in-length (ΔL) measured by DNC for two different sets of peptides measured at different times presented with Gaussian fits superimposed. c, Correlation plot of mean ΔL for (a) (blue) and (b) (red) peptides vs number of amino-acid residues in each peptide, using results of Gaussian fits. Solid lines depict linear fits, with each y-intercept representing the effective loop size L0 for the given experimental conditions. d, Correlation plot of mean absolute distance d (d = L0 − ΔL) vs peptide length; a linear fit over the range 1–20aa is superimposed (R2 = 0.9969). Residuals are shown in the inset with grey shadow highlighting the linear dynamic range (the range over which the measured distance changes linearly with the peptide length) of this caliper, which is approximately 1–20aa. Error bars represent the calculated standard error of the mean.
