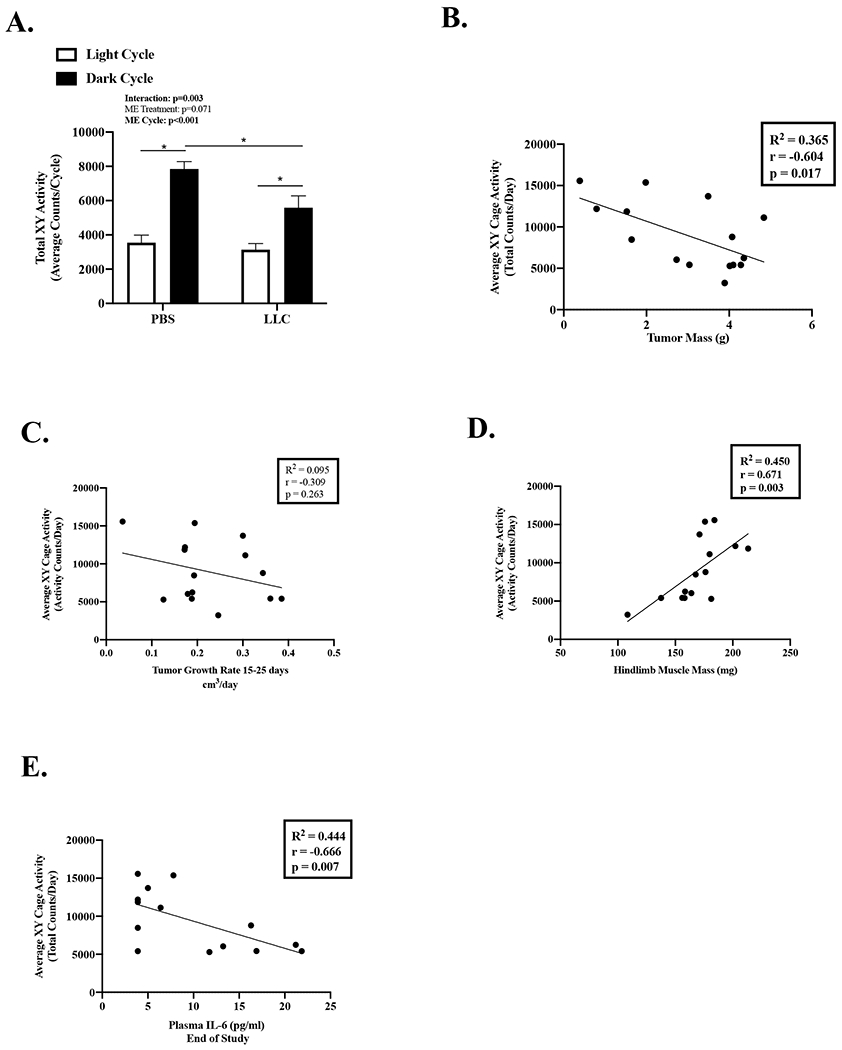
Figure 5: Effect of Tumor Size and Rate on Physical Activity.

Data is expressed as mean (SEM). A. Total Cage XY Activity Counts expressed as 3-day average of the total activity counts per cycle. N=11-16 per group. B. Average XY Cage Activity correlated to tumor mass. C. Average XY Cage Activity correlated to tumor growth rate. D. Average XY Cage Activity correlated to hindlimb muscle mass. E. Average XY Cage Activity correlated to plasma IL-6. Abbreviations: ME: main effect, PBS: phosphate buffered saline, LLC: Lewis Lung Carcinoma, pg/mL: picograms per milliliter, g/min: grams per minute. Two-way repeated measures ANOVA (2-time points x 2 treatments) was used to compare cage activity during the light and dark cycle. (Figure A). Pearson Correlation Coefficient was used for correlations (Figures B-E). Statistical significance was set a p<0.05.
