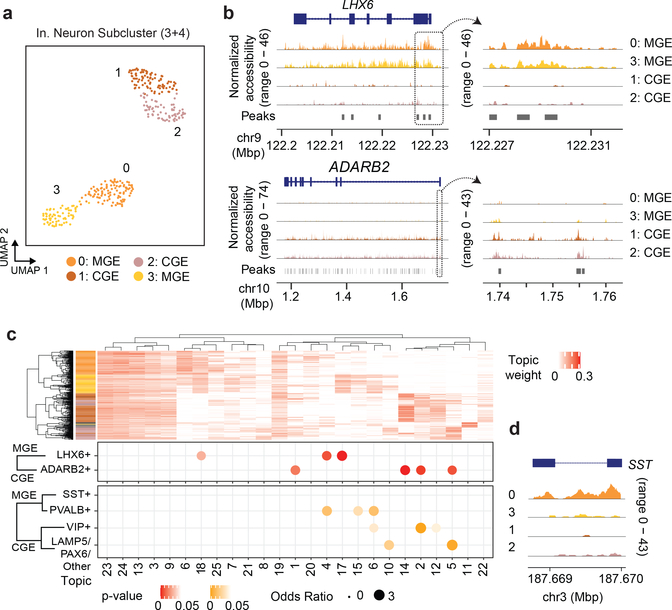
Figure 3 |. s3-ATAC on human cortex inhibitory neurons.
(a) Subclustering and UMAP projection of human cortical inhibitory neurons (clusters 3 and 4 from panel h., n=342) (b) Genome coverage track of human inhibitory neurons (n=342) aggregated over 4 subclusters for genomic locations overlapping MGE and CGE marker genes LHX6 and ADARB2, respectively, with a zoomed in view of the promoter region (on right). (c) Hierarchical clustering of topic weight per cell (top). Hypergeometric test of gene set analysis enrichment for human inhibitory neuron marker genes (bottom; Fisher’s exact test, see Online Methods), with a genome track of SST to delineate MGE cell types (right).

