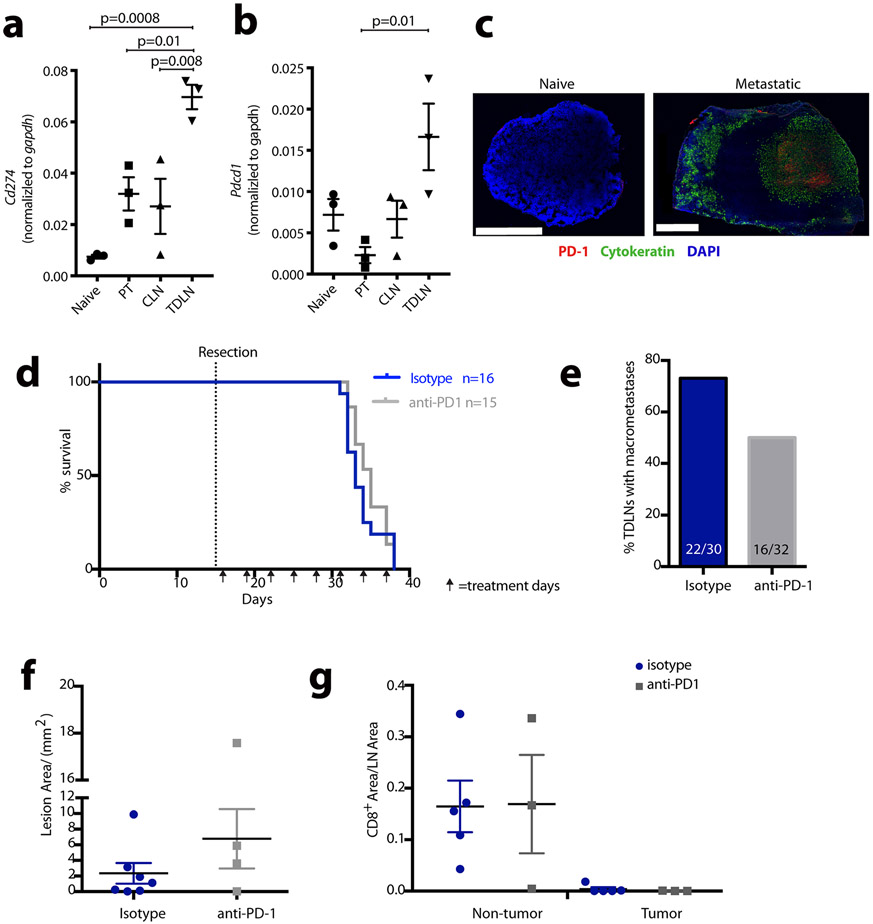
Extended Data Fig. 4 ∣. Effect of anti-PD-1 therapy on lymph node metastasis.
Expression of Cd274 (PD-L1) (a) and Pdcd1 (PD-1) transcript (b) measured by qRT-PCR, in naïve lymph node, primary tumour (PT), contralateral (CLN) and tumour draining lymph nodes (TDLN) from mice bearing 4T1 breast cancer. Relative gene expression calculated using 2ΔCT method, as normalized against Gapdh (n = 3 biological replicates for a and b). c, Representative immunofluorescent staining (4 images taken from each group) of PD-1+ cells (red) in naïve lymph nodes of Balb/c mice and metastatic lymph nodes from Balb/c mice bearing mouse 4T1 cells. Scale bars = 500 μm. Cancer cells are stained green (cytokeratin + ) and DAPI (blue) stains all nucleated cells. d-e, 4T1 tumour-bearing Balb/c mice were treated with 200 μg of anti-PD-1 antibody (BioXcell clone RMP1-14, cat# BE0146) or isotype (rat IgG, Jackson Immunoresearch Laboratories, cat. # 012-000-003) control every 3 days following primary tumour resection 14 days post-implantation. d, Survival of animals treated with anti-PD-1 or isotype antibody. Anti-PD-1 n = 15, isotype; n = 16. e, Incidence of metastatic lymph nodes after anti-PD1 or isotype antibody treatment, as determined by cytokeratin staining of serial lymph node sections. Anti-PD-1 n = 32, isotype; n = 30. f, Tumour area of cytokeratin-positive metastatic lesions after treatment with indicated antibodies. Tumour area was measured using Image J analysis. g, Quantification of CD8 + cells within tumour and non-tumour areas of metastatic lymph nodes from 4T1 tumours in Balb/c mice treated with anti-PD-1 antibody or isotype control. Data plotted as the mean±s.e.m. Statistical significance was tested by one-way ANOVA with Tukey’s Honestly Significant Difference post-hoc test (a-b, f-g). For d, statistical analysis was calculated using Kaplan Meier analysis with non-parametric log-rank test. For e, statistical analysis was performed using a 2×2 chi-square test with Yates correction.

