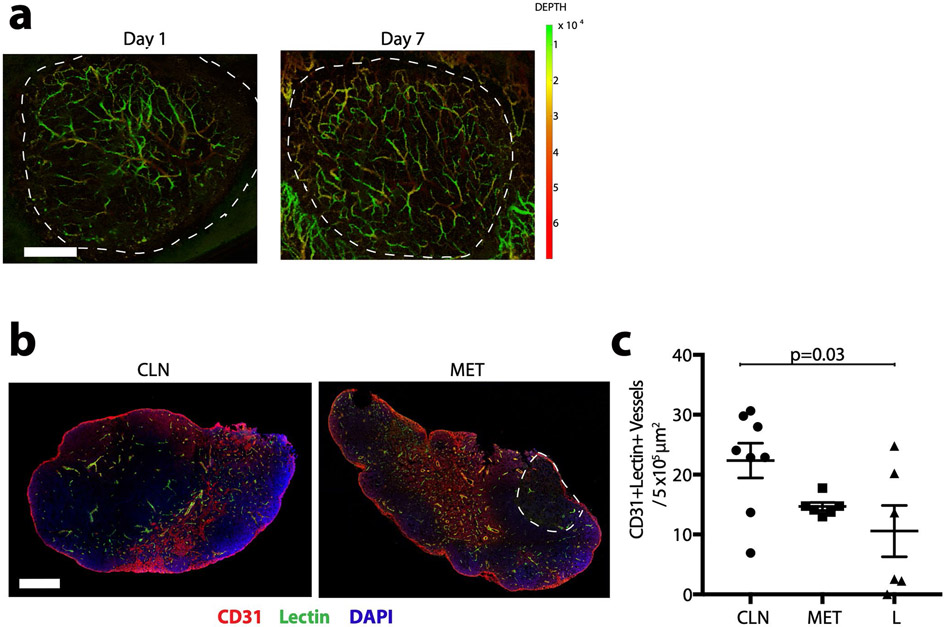
Extended Data Fig. 7 ∣. Vessel perfusion in tumour- draining lymph nodes.
a, Representative false color OCT non-metastatic TDLN on days 1 and 7 post-primary tumour (4T1) resection. Depth is denoted by color, yellow/green = superficial, red=deep. Dashed line indicates the margin of the lymph node. Scale bar = 500 μm. Experiment is representative of 5 biological replicates. b, Representative image of lectin-perfused vessels (green) in contralateral (CLN, left) and metastatic lymph node (MET, right) from animal bearing 4T1 tumour. CD31 + vessels are stained red. Adjacent hematoxylin and eosin-stained sections were used to identify the cancer cell lesion. Dashed line indicates the margin of the lymph node lesion. Scale bar = 500 μm. The number of images taken is reflected in the n values for c. c, From the 4T1 model, quantification of CD31 + Lectin+ vessels in contralateral lymph nodes (CLNs, n = 8), metastatic lymph nodes (MET), n = 6), and only within the lesion (L) of a metastatic lymph node (n = 6). Data plotted as the mean±s.e.m. Statistical significance was tested by one-way ANOVA with Tukey’s Honestly Significant Difference post-hoc test.

