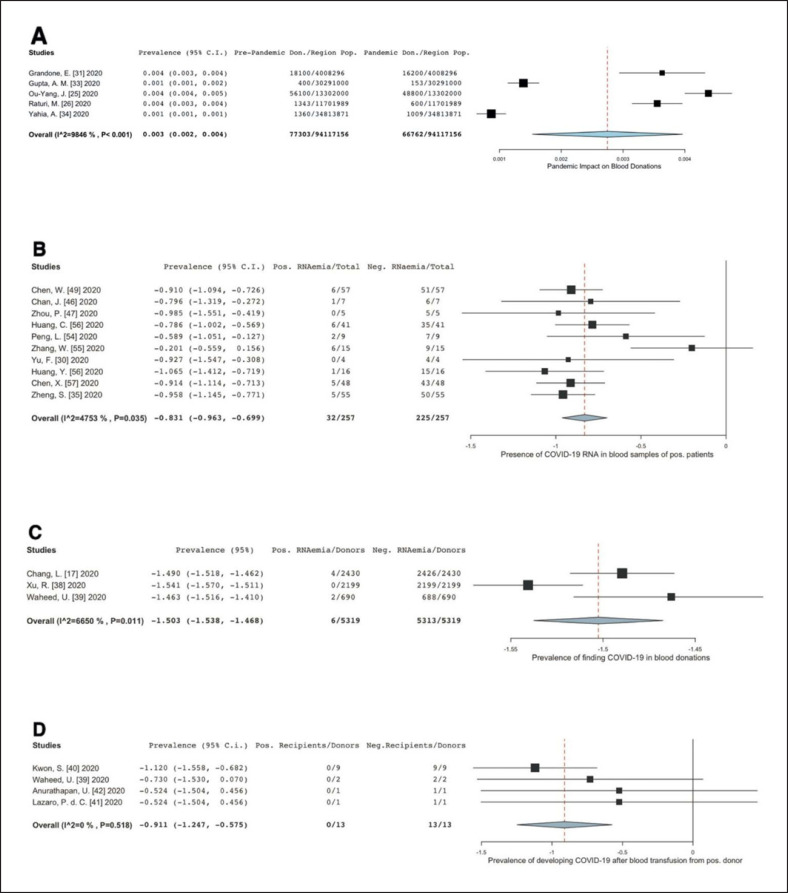
Fig. 2.
Forest plot analyses on the four data sets to show impact of COVID-19 on donation trend and its prevalence of blood. transfusion-transmission. A Impact on donation trends in various countries. The numbers depicted in the graph are obtained by subtracting the donations during pandemic from pre-pandemic period numbers per person as a fraction of the underlying regional population to demonstrate the number of decreased donations. Several articles actually recorded the numbers via trend lines; hence data extraction was manually done by estimating the numbers. Efforts were made to be as accurate as possible. B Prevalence of the presence of COVID-19 viral RNA in the blood samples of positive patients and asymptomatic blood donors. One study, Zhenget al. [35], had two results added into the meta-analysis as they tested blood samples in two different onset of symptoms and added it to their conclusion. C Prevalence of finding RNAaemia in a pool of random donations. Line of null effect is not shown by the data. D Prevalence of COVID-19 blood transfusion-transmission.

