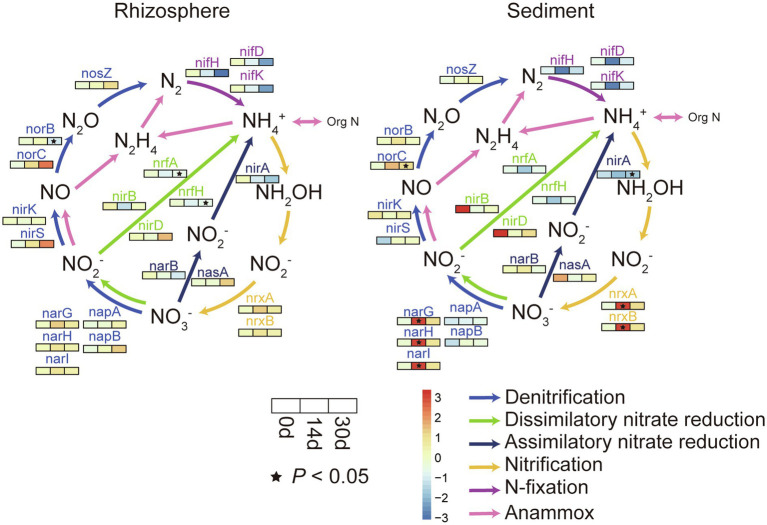
Figure 3.
Relative changes of N-cycling genes in rhizosphere and sediment. For each subfigure, the value represented by the color was calculated by Welch’s t test in STAMP, colors indicate relative differences in gene abundance between the biochar addition groups and control groups, value >0 (red) means biochar addition group has a higher abundance, while value <0 (blue) means control group has a higher abundance. (*p<0.05).

