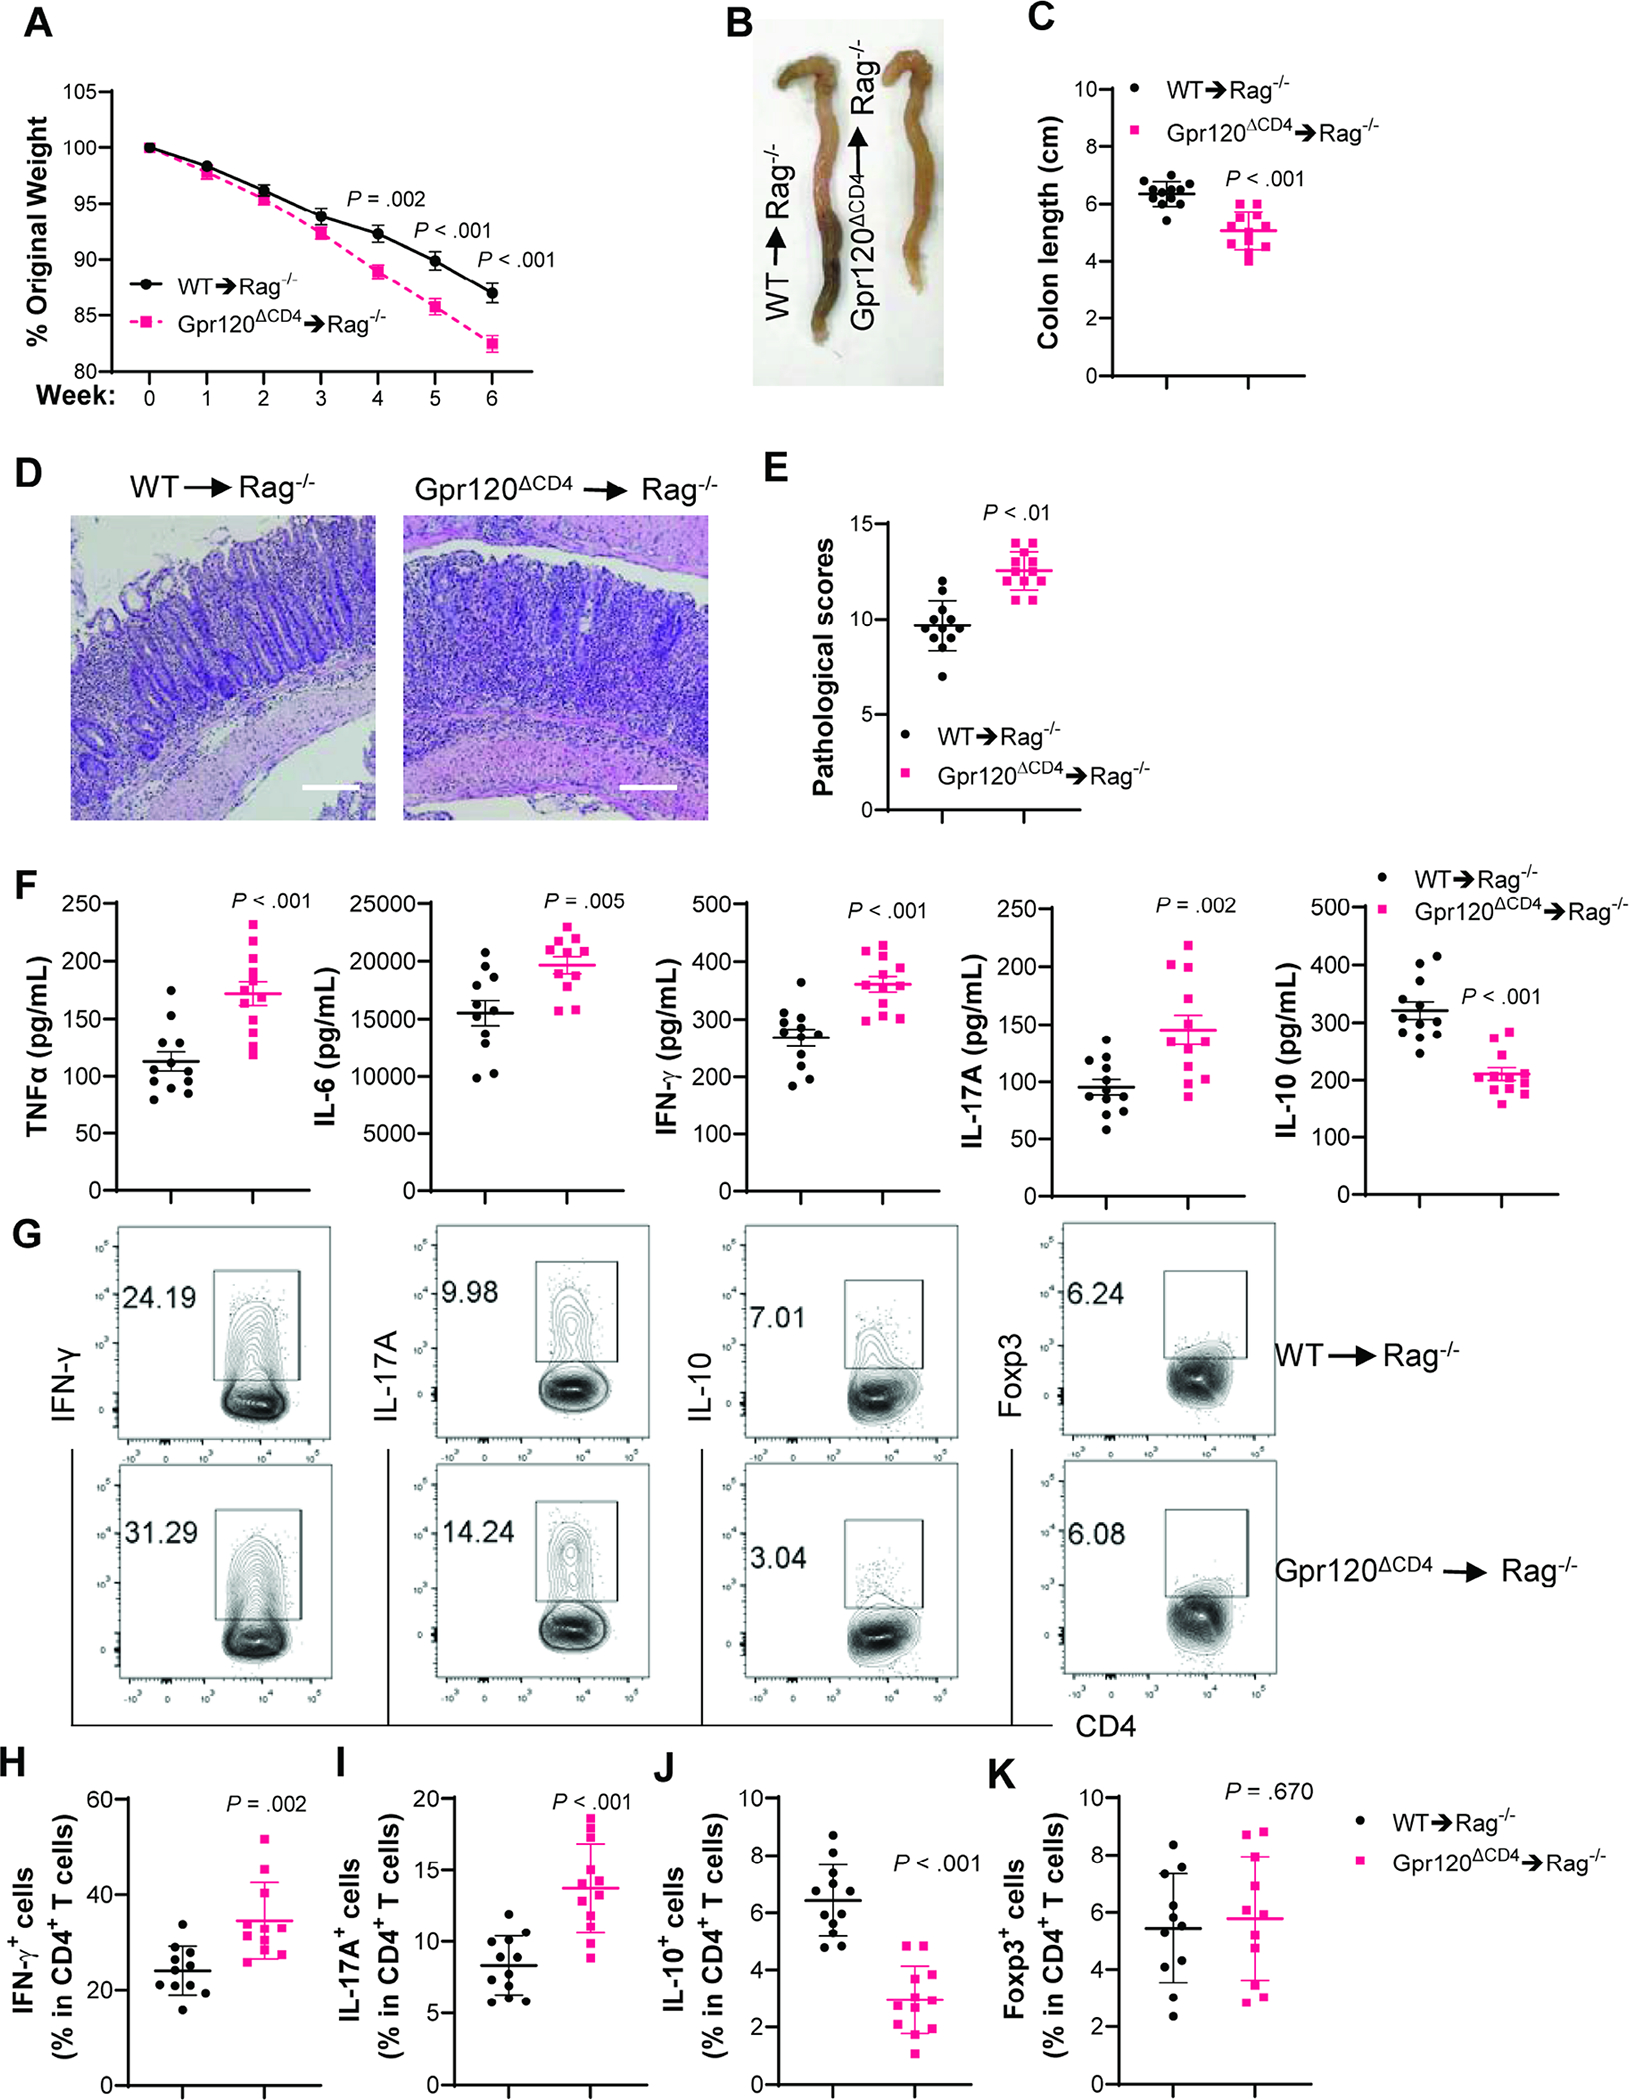
Fig. 2. GPR120-deficient CD4+CD45RBhiT cells induce more severe colitis in Rag−/− mice.

WT and GPR120-deficient CD4+CD45RbhiT cells (1×10⁵ cells/mouse) were intravenously transferred to Rag−/− mice (N=12/group). (A) Mouse weight changes. (B) Representative gross morphology of the colon. (C) Colon length. (D) Representative intestinal H&E staining. (E) Pathological score. (F) Colonic secretion of cytokines. (G) Representative flow cytometry profile of LP CD4+T cells. (H–K) Bar charts of IFNγ+, IL-17A+, IL-10+, and Foxp3+CD4+T cells. All data are pooled from three independent experiments. (D) Scale bar, 300 μm. (A, C, F, and H–K) unpaired Student t-test; (E) Mann–Whitney U test.
